Figures & data
Figure 1 A) Scheme of the process for preparing protein-stabilized nanoemulsions and photographs of nanoemulsions. B) Transmission electron microphotography of food protein-stabilized nanoemulsions: soy protein isolate (SPI), whey protein isolate (WPI), and β-lactoglobulin (β-lg). The scale bar for all images represents 100 nm.
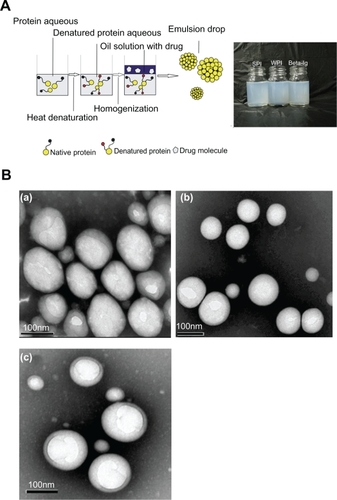
Figure 2 A) Effect of homogenization pressure on centrifugal stability (Ke), mean particle size, and polydispersity index (PI) of food protein-stabilized nanoemulsions. The number of homogenization cycles for the prepared nanoemulsions was 10. A-1) Effect of homogenization pressure on mean particle size (column graph) and PI (line graph). A-2) Effect of homogenization pressure on Ke. B) Effect of cycle number on Ke, mean particle size, and PI of food protein-stabilized nanoemulsions. The homogenization pressure for the prepared nanoemulsions was 800 bars. B-1) Effect of cycle number on mean particle size (column graph) and PI (line graph). B-2) Effect of cycle number on Ke.
Abbreviations: β-lg, β-lactoglobulin; SPI, soy protein isolate; WPI, whey protein isolate.
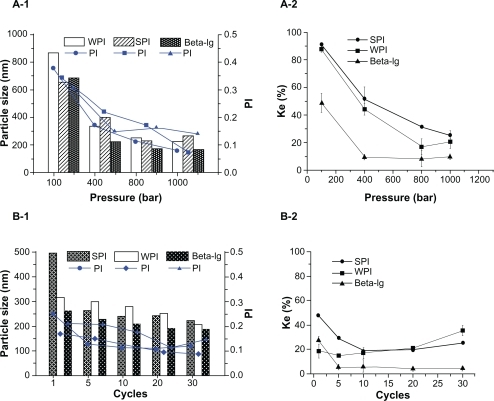
Figure 3 Effect of protein concentration on centrifugal stability (Ke), mean particle size, and polydispersity index (PI) of protein-stabilized nanoemulsions. The nanoemulsions were prepared using the optimized processing conditions, ie, 800 bars and 10 cycles. A) Effect of protein concentration on mean particle size (column graph) and PI (line graph). B) Effect of protein concentration on Ke.
Abbreviations: β-lg, β-lactoglobulin; SPI, soy protein isolate; WPI, whey protein isolate.
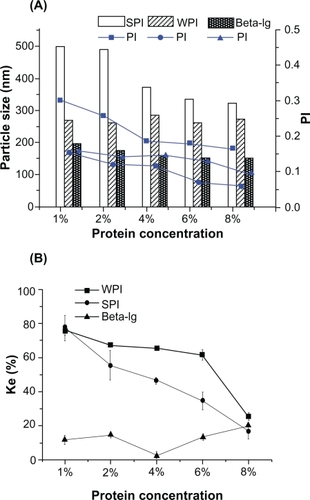
Figure 4 Effect of oil-to-water ratio on centrifugal stability (Ke), mean particle size, and polydispersity index (PI) of protein-stabilized nanoemulsions. The concentration of protein in aqueous phase was 1.5% (wt%). The nanoemulsions were prepared using the optimized processing conditions, ie, 800 bars and 10 cycles. A) Effect of oil-to-water ratio on mean particle size (column graph) and PI (line graph). B) Effect of oil-to-water ratio on Ke.
Abbreviations: β-lg, β-lactoglobulin; SPI, soy protein isolate; WPI, whey protein isolate.
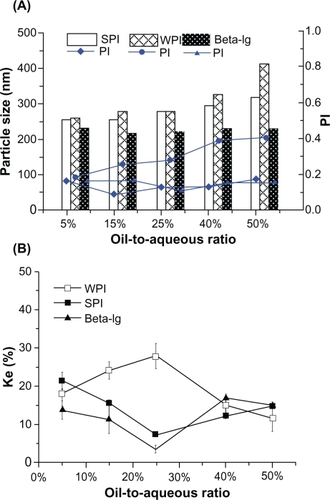
Figure 5 Effect of pH on particle size, polydispersity index (PI), centrifugal stability (Ke), and zeta potential of food protein-stabilized nanoemulsions. The nanoemulsions were prepared using the optimized processing conditions, ie, 800 bars and 10 cycles. A) Effect of pH on mean particle size (column graph) and PI (line graph). B) Effect of pH on zeta potential. C) Effect of pH on Ke.
Abbreviations: β-lg, β-lactoglobulin; SPI, soy protein isolate; WPI, whey protein isolate.
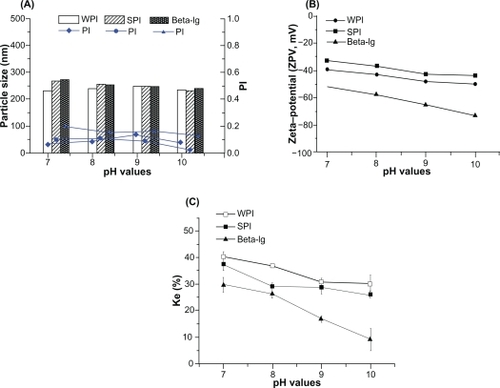
Figure 6 A) Effect of different emulsifiers on mean particle size and polydispersity index (PI) of food protein-stabilized nanoemulsions with/without drug. The amount of emulsifier in the nanoemulsion formulations was 24% (wt%) based on the oil phase. The nanoemulsions were prepared using the optimized processing conditions, ie, 800 bars and 10 cycles (particle size [column graph] and PI [line graph]). B) Effect of different emulsifiers on Ke and zeta potential of food protein-stabilized nanoemulsions with/without drug. The amount of emulsifier in the nanoemulsion formulations was 24% (wt%) based on the oil phase. The nanoemulsions were prepared using the optimized processing conditions, ie, 800 bars and 10 cycles (Ke [column graph) and zeta potential [line graph]).
Abbreviations: β-lg, β-lactoglobulin; SPI, soy protein isolate; WPI, whey protein isolate.
![Figure 6 A) Effect of different emulsifiers on mean particle size and polydispersity index (PI) of food protein-stabilized nanoemulsions with/without drug. The amount of emulsifier in the nanoemulsion formulations was 24% (wt%) based on the oil phase. The nanoemulsions were prepared using the optimized processing conditions, ie, 800 bars and 10 cycles (particle size [column graph] and PI [line graph]). B) Effect of different emulsifiers on Ke and zeta potential of food protein-stabilized nanoemulsions with/without drug. The amount of emulsifier in the nanoemulsion formulations was 24% (wt%) based on the oil phase. The nanoemulsions were prepared using the optimized processing conditions, ie, 800 bars and 10 cycles (Ke [column graph) and zeta potential [line graph]).Abbreviations: β-lg, β-lactoglobulin; SPI, soy protein isolate; WPI, whey protein isolate.](/cms/asset/c867b8d5-70e3-4424-a66f-585a83b3d58d/dijn_a_17282_f0006_c.jpg)
Figure 7 Effect of different emulsifiers on Caco-2 cell viability as determined by 3-(4,5-dimethylthiazol-2-yl)-2,5-diphenyltetrazoliumbromide assay following 4-hour incubation with blank nanoemulsion stabilized by food proteins or other emulsifiers. Error bars indicate standard deviation of five independent measurements.
Notes: aSignificance with respect to negative control (P < 0.05). bSignificance with respect to negative control (P < 0.01).
Abbreviations: β-lg, β-lactoglobulin; SPI, soy protein isolate; WPI, whey protein isolate.
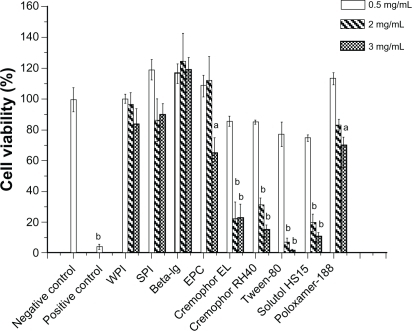
Figure 8 In vitro release profiles of fenofibrate from protein-stabilized nanoemulsions at 37°C in simulated gastric fluid (A) or simulated intestinal fluid (B) containing 2% (w/v) Cremophor EL.
Abbreviations: β-lg, β-lactoglobulin; SPI, soy protein isolate; WPI, whey protein isolate.
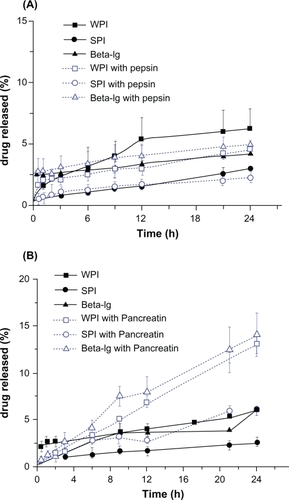
Table 1 Pharmacokinetic parameters after oral administration of protein-stabilized fenofibrate nanoemulsions and fenofibrate oil solutions
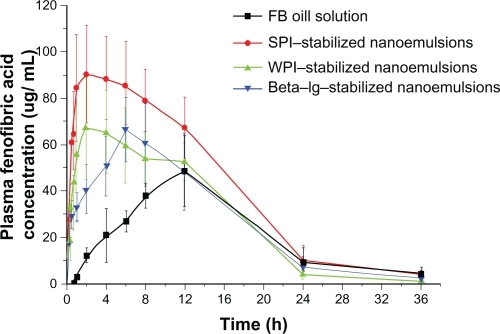
Figure 9 Plasma fenofibric acid concentration as a function of time after a single oral dose of 30 mg/kg equivalents of SPI-, WPI-, and β-lg-stabilized nanoemulsions or an oil solution of fenofibrate (n = 5).
Abbreviations: β-lg, β-lactoglobulin; SPI, soy protein isolate; WPI, whey protein isolate.