Figures & data
Table 1 Primers used in this study
Figure 1 Characterization of nanotubular TiO2 surfaces.
Notes: (A) The surface morphologies of four samples (CP, TNT20, TNT40, and TNT60) observed using SEM at different magnifications. (B) The diameters of the nanotubes. (C) Images of the water contact angles of samples. (D) Analysis of water contact angles in C. Results are presented as mean ± SD (N=3). *P<0.05, **P<0.01.
Abbreviations: CP, commercially pure Ti; TNT20, TiO2 nanotubes generated using 20 V; TNT40, TiO2 nanotubes generated using 40 V; TNT60, TiO2 nanotubes generated using 60 V; SEM, scanning electron microscopy. 10,000×, magnified 10,000 times. 200,000×, magnified 200,000 times.
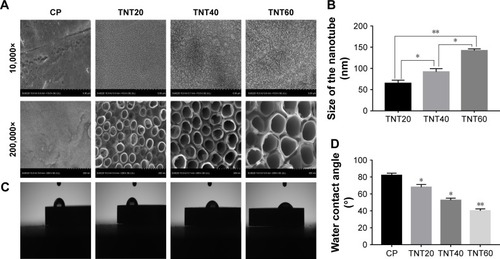
Figure 2 Macrophage behavior on nanotubular TiO2 surface.
Notes: (A) SEM of macrophages incubated for 3 days on different samples (CP, TNT20, TNT40, and TNT60). (B) Confocal detection of the M1 marker protein CD86 after 48 hours of culture. (C) Confocal detection of the M2 marker protein CD206 after 48 hours of culture. (D) Flow cytometry for detection of the membrane surface proteins CD86 and CD206. (E) Analysis of flow cytometry results for CD86-positive rates. (F) Analysis of flow cytometry results for CD206-positive rates. (G) Real-time PCR detection of macrophage polarization and inflammation-related gene expression after 24 hours of culture. (H) Chemiluminescence detection of inflammatory factors in supernatants. (I) Western blot analysis of inflammation-related proteins on CP, TNT20, TNT40, and TNT60 after 20 minutes of culture. (J) Analysis of phospho-IKB-α activity using the images shown in I. (K) ELISA of macrophage-secreted VEGF in supernatants after 72 hours of culture. (L) VEGF gene expression levels in macrophages after 24 hours of culture. Results are presented as mean ± SD (N=3). *P<0.05; **P<0.01.
Abbreviations: CP, commercially pure Ti; TNT20, TNT40, and TNT60, TiO2 nanotubes produced by different voltages; VEGF, vascular endothelial growth factor; SEM, scanning electron microscopy; LM, low magnification; HM, high magnification; PCR, polymerase chain reaction.
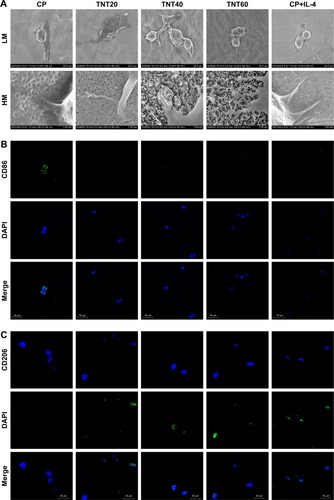
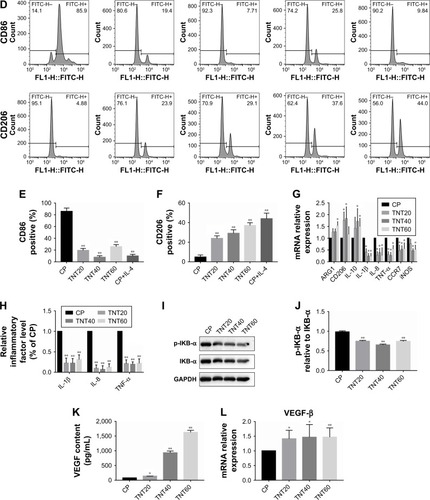
Figure 3 Schematic of cell culture model.
Note: Effects of macrophage supernatants on HUVECs tested under in vitro conditions.
Abbreviations: VEGF, vascular endothelial growth factor; HUVEC, human umbilical vein endothelial cell.
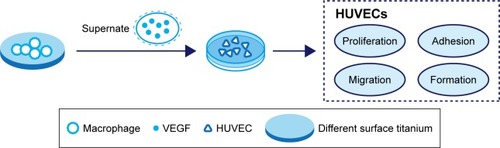
Figure 4 Evaluation of the in vitro behaviors of HUVECs stimulated with conditioned medium.
Notes: (A) Representative images of HUVEC migration. (B) The percentage of coverage after 6 hours of wound healing. (C) Representative images of tube formation for 6 hours. (D) Quantitative analysis of the lengths of new tubes. (E) Quantitative analysis of the number of new tubes. (F) Cell proliferation in HUVECs for 1, 3, and 5 days. (G) Cell adhesion in HUVECs after 2, 4, and 12 hours. (H) Relative expression of the ITGAV and vWF genes in HUVECs after incubation in macrophage CM for 24 hours. Results are presented as means ± SD (N=3). *P<0.05; **P<0.01.
Abbreviations: HUVEC, human umbilical vein endothelial cell; CP, TNT20, TNT40, and TNT60, conditioned medium from commercially pure Ti or TiO2 nanotubes produced by 20, 40, or 60 V; ITGAV, integrin alpha chain V; vWF, von Willebrand factor.
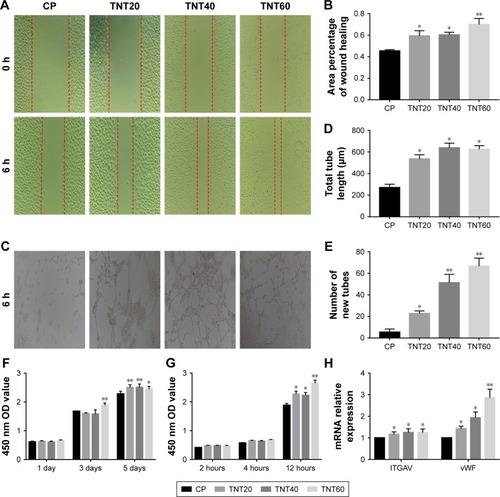
Figure 5 Axitinib inhibited endothelialization.
Notes: (A) Representative images of HUVEC migration. (B) The percentage of coverage after 6 hours of wound healing. (C) Representative images of tube formation for 6 hours. (D) Cell proliferation in HUVECs for 1, 3, and 5 days. (E) Determination of AKT and ERK1/2 phosphorylation in HUVECs by Western blotting. (F) Analysis of AKT and ERK1/2 phosphorylation using the images shown in E. Results are presented as mean ± SD (N=3). *P<0.05, **P<0.01.
Abbreviations: HUVEC, human umbilical vein endothelial cell; CP, TNT20, TNT40, and TNT60, conditioned medium from commercially pure Ti or TiO2 nanotubes produced by 20, 40, or 60 V; CM, conditioned medium.
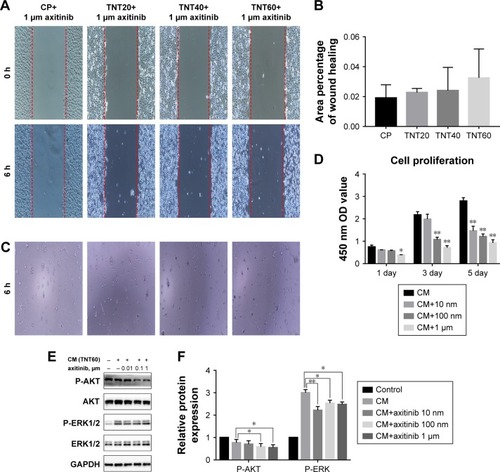
Figure 6 Effects of AKT and ERK1/2 pathway inhibitors on endothelialization.
Notes: (A) Representative images of HUVEC migration. (B) The percentage of coverage after 6 hours of wound healing. (C) Representative images of tube formation for 6 hours. (D) Cell proliferation in HUVECs for 1, 3, and 5 days. (E) Determination of AKT and ERK1/2 phosphorylation in HUVECs by Western blot. (F) Analysis of AKT and ERK1/2 phosphorylation using the images shown in E. Results are presented as mean ± SD (N=3). *P<0.05, **P<0.01.
Abbreviations: LY294002, AKT pathway inhibitor; PD98059, ERK1/2 pathway inhibitor; HUVEC, human umbilical vein endothelial cell; CP, TNT20, TNT40, and TNT60, conditioned medium from commercially pure Ti or TiO2 nanotubes produced by 20, 40, or 60 V; CM, conditioned medium.
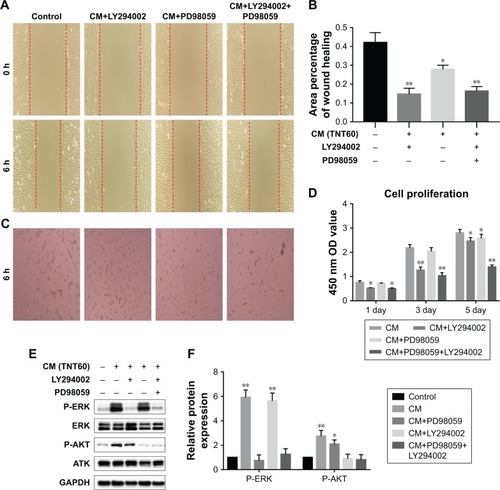
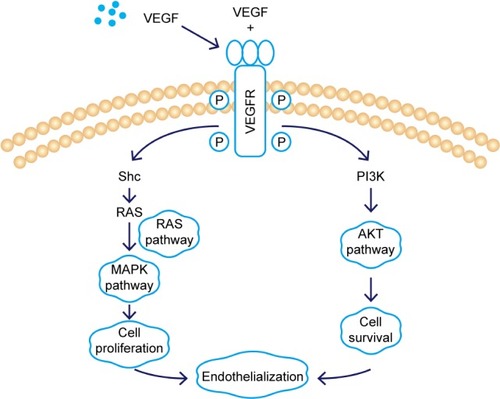
Figure 7 Schematic of the VEGF signaling pathway acting on endothelialization.
Abbreviations: VEGF, vascular endothelial growth factor; VEGFR, vascular endothelial growth factor receptor; Shc, src homology 2 domain containing; RAS, family of related proteins.