Figures & data
Figure 1 XRD pattern of beta-tricalcium phosphate and hydroxyapatite.
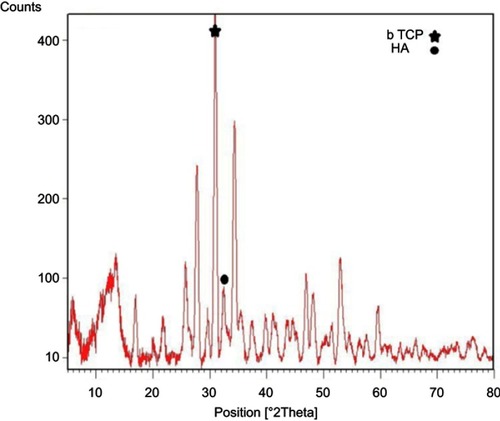
Figure 2 FTIR pattern of beta-tricalcium phosphate and hydroxyapatite.
Abbreviation: FTIR, Fourier Transform Infrared Spectroscopy.
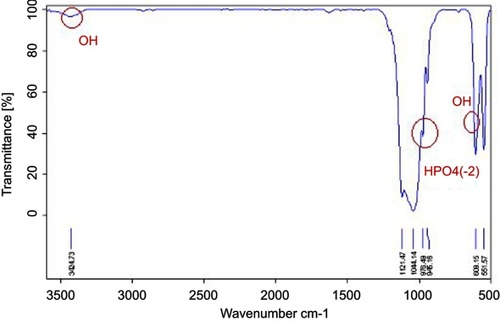
Figure 3 Structural and morphological characterization of synthesized GO: XRD (A) and AFM (B) of graphene.
Abbreviations: XRD, x-ray diffraction; AFM, Atomic Force Microscopy.
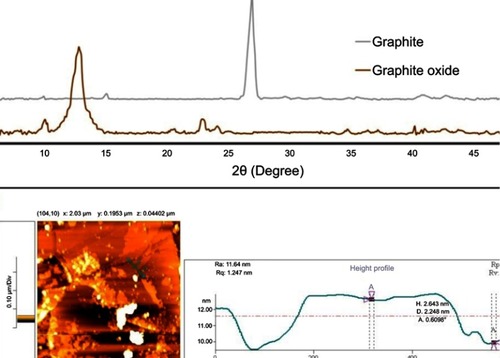
Table 1 Calcium phosphate cement setting time
Table 2 Compressive strength and young modulus of composite cement
Figure 4 Stress-strain curve of composite cement.
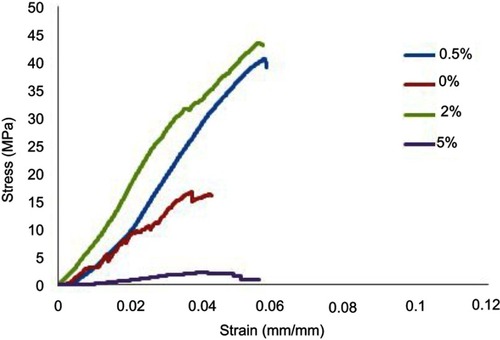
Figure 5 XRD patterns of 0.5% (A) and 0% (B) CPC/GO composite.
Abbreviations: CPC, calcium phosphate cement CPC/GO scaffold; XRD, x-ray diffraction.
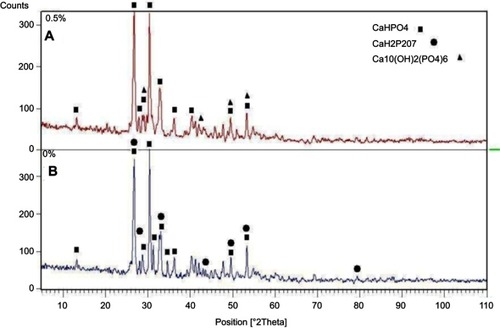
Figure 6 FTIR patterns of 0% and 0.5% CPC/GO composite.
Abbreviations: CPC, calcium phosphate cement CPC/GO scaffold; FTIR, Fourier Transform Infrared Spectroscopy.
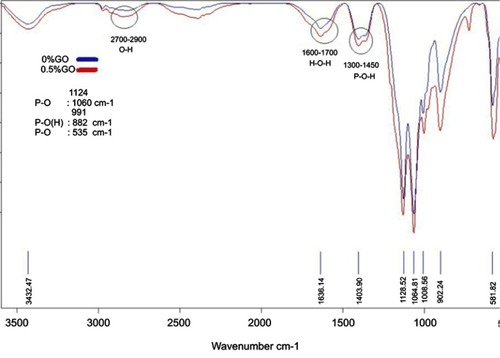
Table 3 pH changes of cements
Table 4 Porosity of cements
Figure 7 FESEM pictures of 0%, 0.5%, 2% and 5% cements after soaking for 7 days.
Abbreviation: FESEM, Emission scanning electron microscopy.
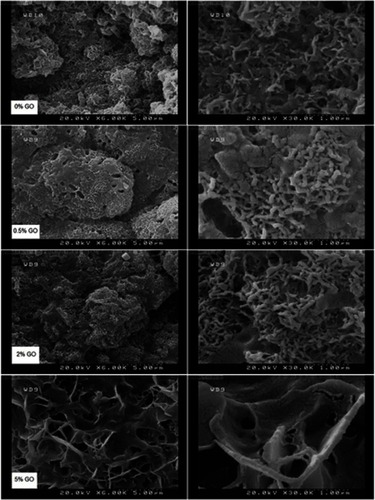
Figure 8 FESEM pictures of 0%, 0.5%, 2% and 5% cements after soaking for 14 days.
Abbreviation: FESEM, Emission scanning electron microscopy.
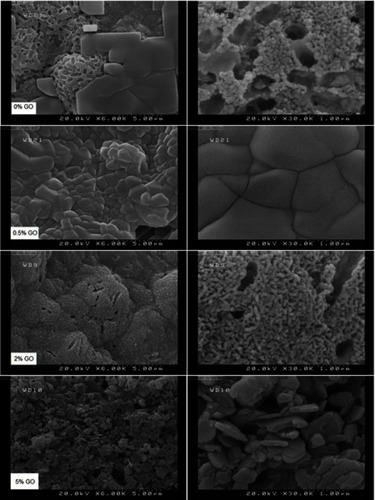
Figure 9 The cytotoxicity graph of the composite cement extract at intervals of 1, 3 and 7 days (⩽0.05).
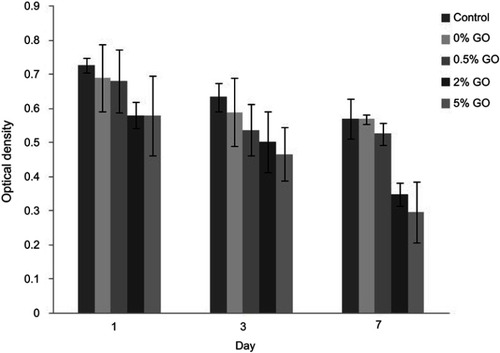
Figure 10 FESEM of cements cell attachment after 1 day.
Abbreviation: FESEM, Emission scanning electron microscopy.
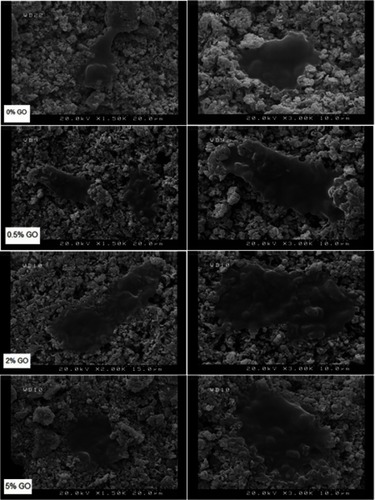
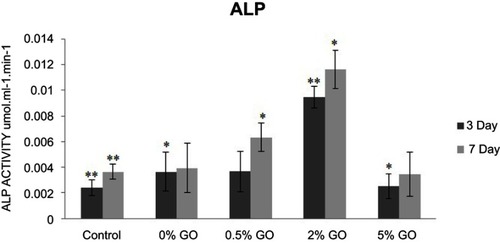
Figure 11 ALP activity of the MG63 cells cultured on specimens for 3 and 7 days.
Abbreviations: ALP, Alkaline phosphatase activity; GO, graphene oxide.