Figures & data
Figure 1 Schematic illustration of preparation of FA-Rg5-BSA NPs.
Abbreviations: BSA, bovine serum albumin; Rg5, ginsenoside Rg5; FA, folic acid; NPs, nanoparticles.
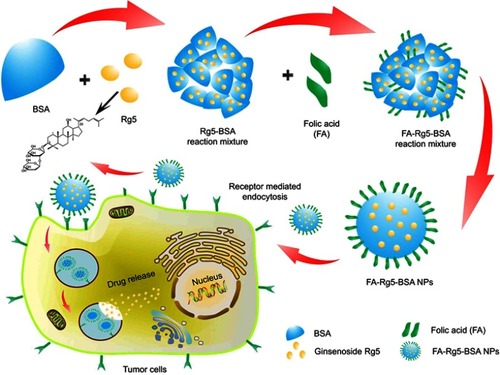
Figure 2 (A) Hydrodynamic size distributions, (B) Zeta potentials, (C) SEM and (D) TEM images of Rg5-BSA NPs (top) and FA-Rg5-BSA NPs (bottom), and (E) UV-vis absorption spectra determining the amount of FA in Rg5-BSA NPs.
Abbreviations: BSA, bovine serum albumin; Rg5, ginsenoside Rg5; FA, folic acid; NPs, nanoparticles; SEM, scanning electron microscopy; TEM, transmission electron microscopy.
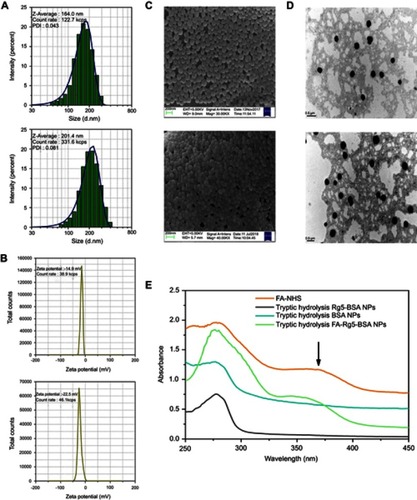
Table 1 Key parameters of Rg5-BSA NPs and FA-Rg5-BSA NPs
Figure 3 Characterization of folic acid modification.
Notes: (A) The FT-IR and (B) 1H NMR spectra of BSA, Rg5, FA, Rg5-BSA NPs and FA-Rg5-BSA NPs.
Abbreviations: BSA, bovine serum albumin; Rg5, ginsenoside Rg5; FA, folic acid; NPs, nanoparticles; FT-IR, fourier transform infrared spectroscopy; 1H NMR, nuclear magnetic resonance.
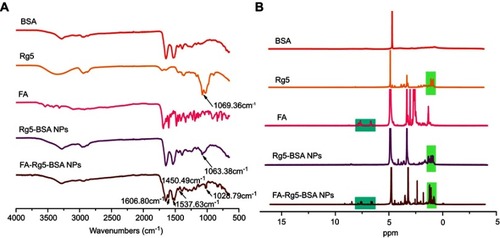
Figure 4 The stability of Rg5-BSA NPs and FA-Rg5-BSA NPs over time.
Notes: The stability of Rg5-BSA NPs (A) and FA-Rg5-BSA NPs (B) in water at 4 °C for 8 weeks. Data are represented as mean ± SD, n=3.
Abbreviations: BSA, bovine serum albumin; Rg5, ginsenoside Rg5; FA, folic acid; NPs, nanoparticles; PDI, polydispersity index.
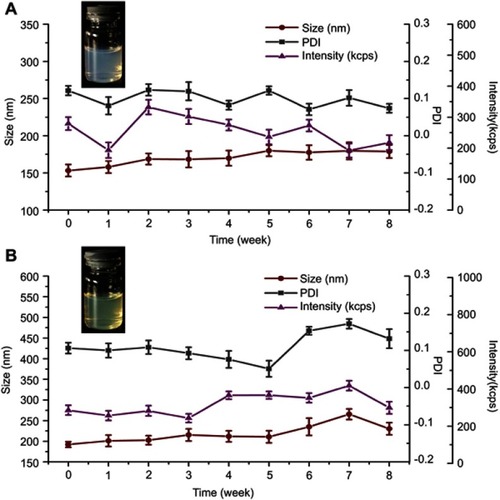
Figure 5 The release curve of Rg5 from Rg5-BSA NPs and FA-Rg5-BSA NPs.
Notes: The in vitro cumulative release percentage of Rg5 from Rg5-BSA NPs and FA-Rg5-BSA NPs over 140 hrs at different pH values (pH 5 and 7.4).Abbreviations: BSA, bovine serum albumin; Rg5, ginsenoside Rg5; FA, folic acid; NPs, nanoparticles.
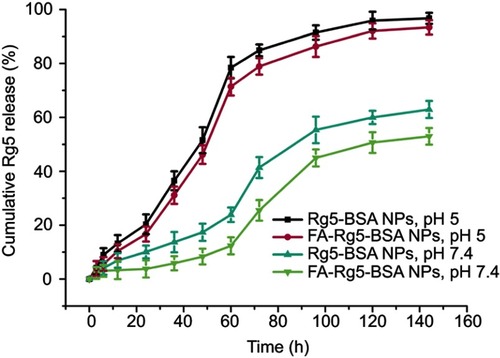
Table 2 The IC50 of Rg5, Rg5-BSA NPs and FA-Rg5-BSA NPs in MCF-7 and L929 cells
Figure 6 In vitro cell viability assay.
Notes: Cell viability of blank BSA NPs, FA-BSA NPs against MCF-7 cells (A) and L929 cells (B) after incubating for 72 hrs; cell toxicity of Rg5, Rg5-BSA NPs and FA-Rg5-BSA NPs against MCF-7 cells (C, E) and L929 cells (D, F) for 24 hrs and 48 hrs. Values are represented as mean ± SD. (n=3, *P<0.05, **P<0.01).
Abbreviations: BSA, bovine serum albumin; Rg5, ginsenoside Rg5; FA, folic acid; NPs, nanoparticles.
Figure 7 Cell apoptosis assay of MCF-7 cells treated with Rg5, Rg5-BSA NPs and FA-Rg5-BSA NPs by (A) Hoechst 33,342, AO/EB, and (B) Annexin V-FITC/PI staining.
Note: Magnification 20× and scale bar is 100 µm.
Abbreviations: BSA, bovine serum albumin; Rg5, ginsenoside Rg5; FA, folic acid; NPs, nanoparticles; AO/EB, Acridine orange/ethidium bromide.
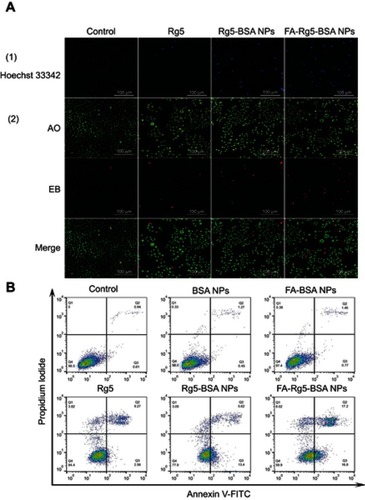
Figure 8 The cellular uptake of FITC-labeled NPs treated with MCF-7 cells for 3 hrs was observed by CLSM (A) and flow cytometry (B).
Note: Magnification 40× and scale bar is 50 µm.
Abbreviations: BSA, bovine serum albumin; Rg5, ginsenoside Rg5; FA, folic acid; NPs, nanoparticles; FITC, fluorescein isothiocyanate; CLSM, confocal laser scanning microscopy.
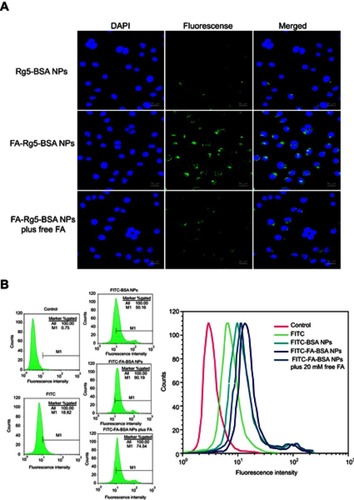
Figure 9 Rg5, Rg5-BSA NPs and FA-Rg5-BSA NPs significantly inhibited the growth of MCF-7 xenograft in vivo.
Notes: (A) The image of MCF-7 xenograft tumors with different treatments at 21 days. (B) Tumor volume and (C) body weight were measured every 3 days. (D) Tumor weight after 21 days treatment. p<0.05 was considered to have a significant difference. Different letters indicate significant differences between each group.
Abbreviations: BSA, bovine serum albumin; Rg5, ginsenoside Rg5; FA, folic acid; NPs, nanoparticles.
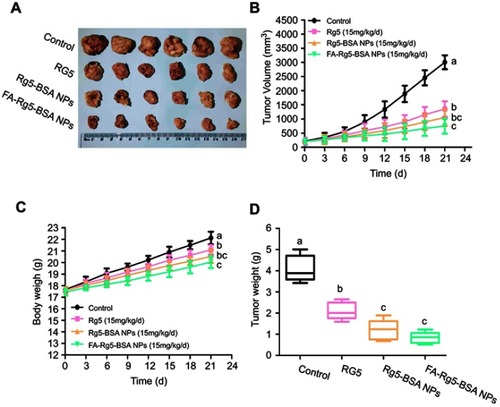
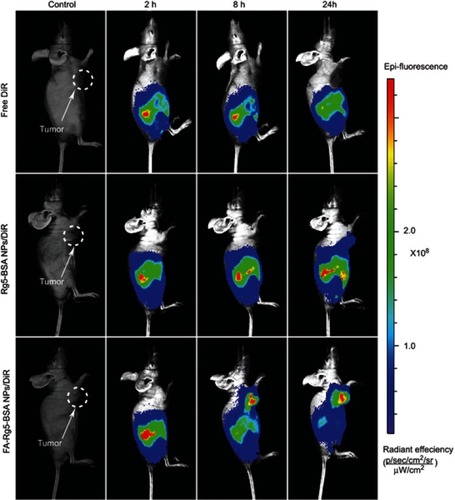
Figure 10 The in vivo real-time biodistribution imaging.
Notes: MCF-7 tumor-bearing mice treated with free DiR, Rg5-BSA NPs/DiR, and FA-Rg5-BSA NPs/DiR at 2 h, 8 h and 24 h.
Abbreviations: BSA, bovine serum albumin; Rg5, ginsenoside Rg5; FA, folic acid; NPs, nanoparticles; DiR, dioctadecyl-tetramethyl indotricarbocyanine iodide.