Figures & data
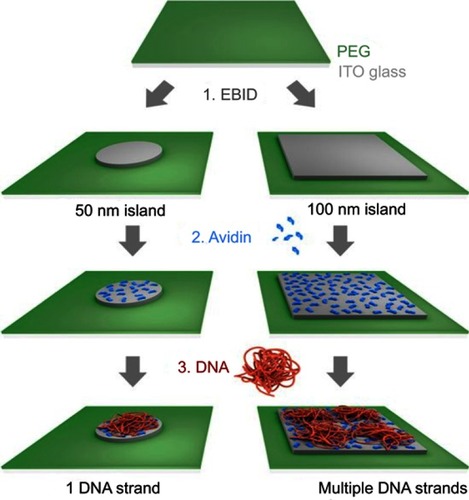
Figure 1 Nanoparticle size, shape, and surface charge dictate biodistribution among the different organs including the lungs, liver, spleen and kidneys.
Notes: (A) Spherical particles, including gold nanoparticles, liposomes, and polymeric micelles/nanoparticles can vary in size and differ in vivo fates. Particles >150 nm are entrapped within the liver and spleen while the small-sized nanoparticles are filtered out through the kidneys. (B) Different nanoparticle shapes exhibit unique flow characteristics that substantially alter circulating lifetimes, cell membrane interactions and macrophage uptake, which in turn affect biodistribution among the different organs. (C) Charge of nanoparticles influences opsonization, circulation times and interaction with macrophages. Positively charged particles are more prone to sequestration by macrophages in the lungs, liver, and spleen. Neutral and slightly negatively charged nanoparticles have longer circulation lifetimes and less accumulation in the aforementioned organs. Reprinted by permission from Springer Nature: Nature, Nature Biotechnology (https://www.nature.com/nbt/), Blanco E, Shen H, Ferrari M. Principles of nanoparticle design for overcoming biological barriers to drug delivery. Nat Biotechnol. 2015;33(9):941–951, Copyright © 2015.Citation55
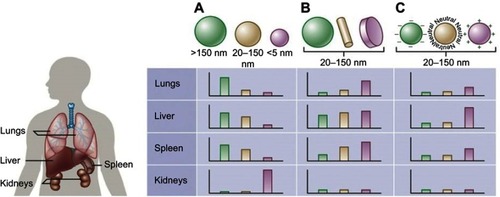
Figure 2 Intravital microscopy images showing soft (A) and rigid (B) discoidal polymeric nanoconstructs (DPNs) within the tortuous and abnormal tumor microvasculature, respectively. (C) Bar graph summarizing the level of DPN accumulation with the tumor microvasculature.
Note: Reprinted with permission from Key J, Palange AL, Gentile F, et al. Soft discoidal polymeric nanoconstructs resist macrophage uptake and enhance vascular targeting in tumors. ACS Nano. 2015;9(12):11628–11641. Copyright © 2015 American Chemical Society.Citation27
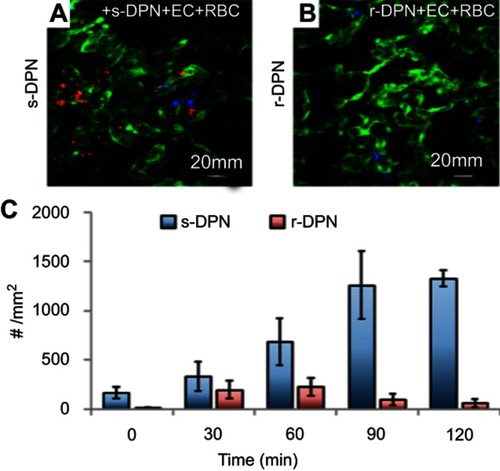
Table 1 Advanced nanofabrication technique for the synthesis of diverse nanoparticles and their advantages
Figure 3 The left side shows (A) a schematic illustration of the procedure to fabricate monodisperse polymer microparticles and (B) optical microscopy image showing the orifice of the flow-focusing region generating droplets of dichloromethane (DCM) in water. The right-hand side shows (A, B) scanning electron microscopy images of monodisperse poly(lactic-co-glycolic acid) (PLGA) microparticles with a diameter of approximately 28 μm. (C) Size distribution of the microparticles measured using a coulter counter.
Note: Reprinted with permisson from Xu QB, Hashimoto M, Dang TT, et al. Preparation of monodisperse biodegradable polymer microparticles using a microfluidic flow-focusing device for controlled drug delivery. Small. 2009;5(13):1575–1581. Copyright © 2009 Wiley‐VCH Verlag GmbH & Co. KGaA, Weinheim.Citation30
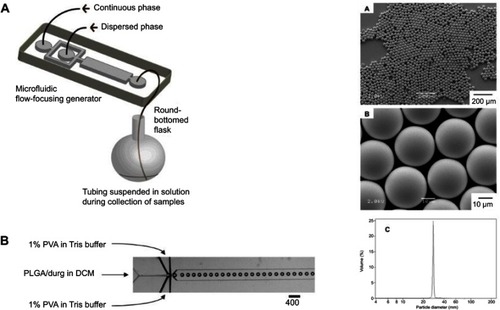
Figure 4 iNPG-pDox characterization and pDox (polymeric drug) assembly and release from iNPG (injectable nanoparticle generator).
Notes: (A) Schematic diagram depicting iNPG-pDox composition, pDox prodrug encapsulation, and pDox nanoparticle assembly and release from nanopores. (B) Z-series confocal microscopy imaging of the iNPG-pDox particles, highlighting the presence of pDox (red) within the nanopores of the silicon carrier particle (gray). Scale bar, 1 µm. (C) Three dimensional reconstruction following sagittal cross-sectioning of the iNPG-pDox particles, depicting pDox (red) within the nanopores of the silicon carrier particle (gray), as well as the presence of pDox nanoparticles (red) released from the microparticles. Scale bar, 1 µm. (D) AFM analysis of size distribution of pDox nanoparticles released from iNPG-pDox at pH 7.4. (E) Cryogenic TEM of pDox nanoparticles released from iNPG-pDox at pH 7.4. Scale bar, 150 nm. Reprinted by permission from Springer Nature: Nature, Nature Biotechnology (https://www.nature.com/nbt/), Xu R, Zhang G, Mai J, et al. An injectable nanoparticle generator enhances delivery of cancer therapeutics. Nat Biotechnol. 2016;34(4):414–418, Copyright © 2016.Citation32
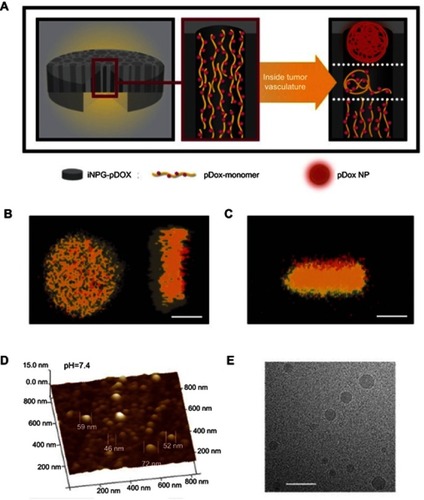
Figure 5 Inhibition of tumor growth and prolonged survival in mice bearing 4T1 tumor metastases to the liver and lung after treatment with iNPG-pDox.
Note: Reprinted by permission from Springer Nature: Nature, Nature Biotechnology (https://www.nature.com/nbt/), Xu R, Zhang G, Mai J, et al. An injectable nanoparticle generator enhances delivery of cancer therapeutics. Nat Biotechnol. 2016;34(4):414–418, Copyright © 2016.Citation32
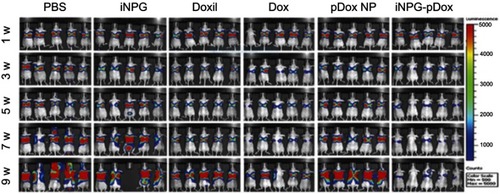
Figure 6 Scheme showing the imprint lithography method used to fabricate different shapes of nanoparticles.
Note: Reprinted with permission from Merkel TJ, Herlihy KP, Nunes J, Orgel RM, Rolland JP, DeSimone JM. Scalable, shape-specific, top-down fabrication methods for the synthesis of engineered colloidal particles. Langmuir. 2010;26(16):13086–13096. Copyright © 2010 American Chemical Society.Citation37
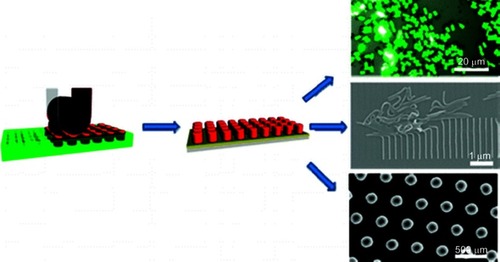
Figure 7 Schematic illustration of the pattern-writing process using an optically controlled microbubble on a plasmonic substrate.
Note: Reprinted with permission from Lin LH, Peng XL, Mao ZM, et al. Bubble-Pen Lithography. Nano Lett. 2016;16(1):701–708. Copyright © 2016 American Chemical Society.Citation41
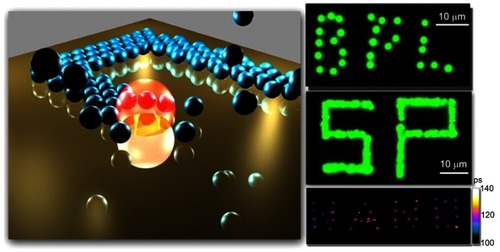
Figure 8 Micrographs of PRINT particles varying in both size and shape.
Note: (A–C) Scanning electron micrograph of the cubic series of particles (diameters = 2 μm [A], 3 μm [B], and 5 μm [C]). (D–F) Fluorescence micrographs of the cubic series of particles (diameters = 2 μm [D], 3 μm [E], and 5 μm [F]). (G and H) Scanning electron micrographs of the cylindrical series of microparticles having the same height (1 μm), but varying diameters (diameters = 0.5 μm [G] and 1 μm [H]). (I–K) Scanning electron micrographs of the series of cylindrical nanoparticles (diameters = 200 nm, height = 200 nm [I]; diameter = 100 nm, height = 300 nm [J]; diameter = 150 nm, height = 450 nm [K]). Scale bars, A–F, 20 μm; G–K, 1 μm. Reprinted with permission from Gratton SE, Ropp PA, Pohlhaus PD, et al. The effect of particle design on cellular internalization pathways. Proc Natl Acad Sci USA. 2008;105(33):11613–11618. Copyright © 2008 National Academy of Sciences.Citation43
![Figure 8 Micrographs of PRINT particles varying in both size and shape.Note: (A–C) Scanning electron micrograph of the cubic series of particles (diameters = 2 μm [A], 3 μm [B], and 5 μm [C]). (D–F) Fluorescence micrographs of the cubic series of particles (diameters = 2 μm [D], 3 μm [E], and 5 μm [F]). (G and H) Scanning electron micrographs of the cylindrical series of microparticles having the same height (1 μm), but varying diameters (diameters = 0.5 μm [G] and 1 μm [H]). (I–K) Scanning electron micrographs of the series of cylindrical nanoparticles (diameters = 200 nm, height = 200 nm [I]; diameter = 100 nm, height = 300 nm [J]; diameter = 150 nm, height = 450 nm [K]). Scale bars, A–F, 20 μm; G–K, 1 μm. Reprinted with permission from Gratton SE, Ropp PA, Pohlhaus PD, et al. The effect of particle design on cellular internalization pathways. Proc Natl Acad Sci USA. 2008;105(33):11613–11618. Copyright © 2008 National Academy of Sciences.Citation43](/cms/asset/673014ac-8c3b-46be-90eb-f5b327ca17cf/dijn_a_12191028_f0008_c.jpg)
Figure 9 Scheme illustrating the generation of nanoarrays of individual DNA strands using 50 nm islands (left) and arrays with multiple DNA strands per 100×100 nm islands (right).
Note: Reproduced from Hager R, Halilovic A, Burns JR, Schaffler F, Howorka S. Arrays of individual DNA molecules on nanopatterned substrates. Sci Rep. 2017;7:42075 (https://creativecommons.org/licenses/by/4.0/).Citation46