Figures & data
Figure 1 FESEM images and EDX of (A, B) PE, (C, D) PE/WG and (E, F) PE/WG/TiO2. Sample with size of 1 cm * 1 cm was cut and imaged in Hitachi SU8020 at different magnifications.
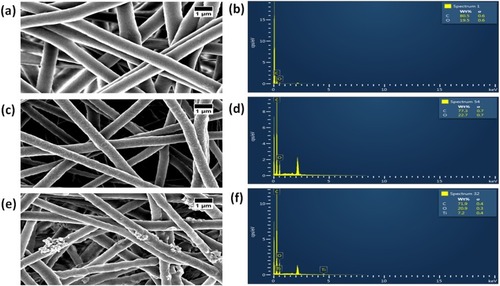
Figure 2 FTIR of PE (blue line), PE/WG (red line) and PE/WG/TiO2 (green line). Sample with size of 1 cm * 1 cm was cut and measured in wavelength range between 600 and 4000 cm−1 in Nicolet iS5.
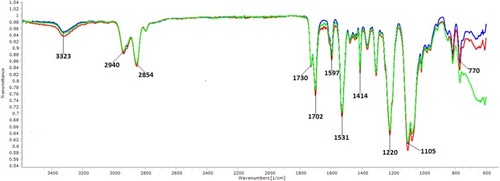
Figure 3 XRD images of a) PE (black line), b) PE/WG (red line) and c) PE/WG/TiO2 (blue line). Sample with size of 1 cm * 1 cm was cut and recorded in Rigaku having CuKα radiation in angle between 10° and 90°.
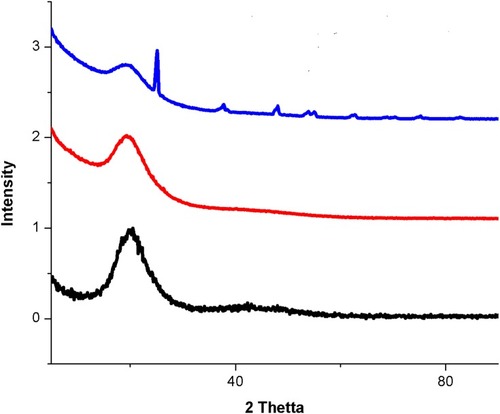
Table 1 Weight Loss Peaks Of The Electrospun Membranes
Figure 4 (A) TGA and (B) Weight residue of PE (black line), PE/WG (red line) and PE/WG/TiO2 (blue line). Sample weighing 3 mg was heated between temperature range of 30-1000°C under nitrogen atmosphere in Perkin-Elmer TGA unit.
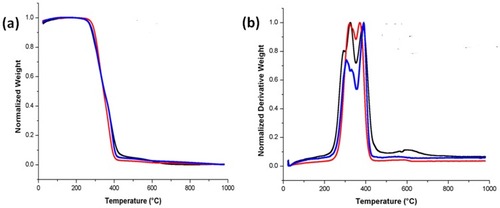
Figure 5 Tensile strength of PE (black line), PE/WG (red line) and PE/WG/TiO2 (blue line). Sample with size of 4 cm * 1 0.5 cm was stretched at a cross head speed of 10 mm/min with a 500 N load cell in Gotech Testing Machines, AI-3000.
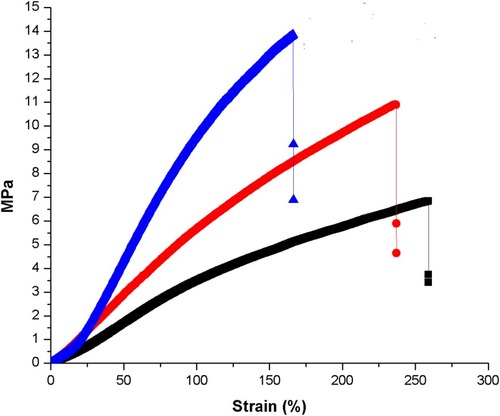
Figure 6 AFM images of (A) PE, (B) PE/WG and (C) PE/WG/TiO2. Sample with size of 1 cm * 1 cm was cut and scanned in 20 * 20 µm size with 256 * 256 pixels under normal atmosphere in Nanowizard, JPK instruments.
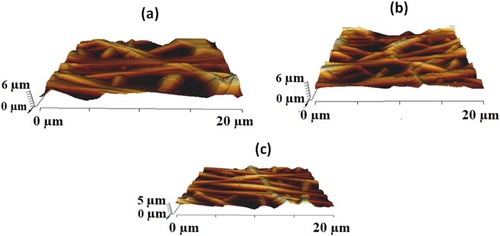
Figure 7 (A) APTT, (B) PT and (C) haemolytic assay of PE, PE/WG and PE/WG/TiO2. For APTT assay sample with size of 1 cm * 1 cm was added with 50 µL of platelet-poor plasma (PPP) followed by incubating with 50 µL of reagent (rabbit brain cephaloplastin) and 50 µL CaCl2 (0.025 M) to calculate the blood clotting time. For PT assay sample with size of 1 cm * 1 cm was added with 50 µL of platelet-poor plasma (PPP) followed by incubating with 50 µL of thromboplastin (Factor III) to calculate the blood clotting time. For haemolytic assay samples with size of 1 cm * 1 cm added to the mixture of citrated blood and diluted saline (4:5 v/v%) for 1 hr at 37°C. After this, the samples were centrifuged and optical density (OD) was measured at 542 nm.
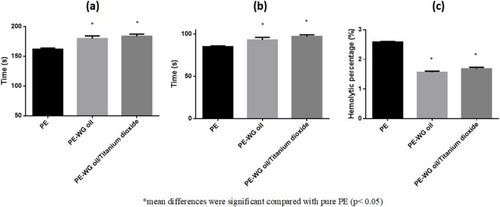
Figure 8 SEM images of calcium deposition of (A) PE, (C) PE/WG and (E) PE/WG/TiO2 and EDX graph showing calcium deposition of (B) PE, (D) PE/WG and (F) PE/WG/TiO2. Samples (1 * 1 cm2) left in 1.5x SBF (pH 7.4; 37°C) for 14 days was imaged in Hitachi Tabletop TM3000.
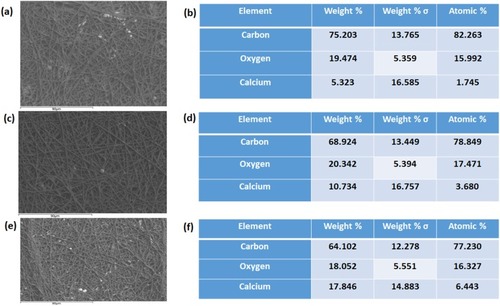
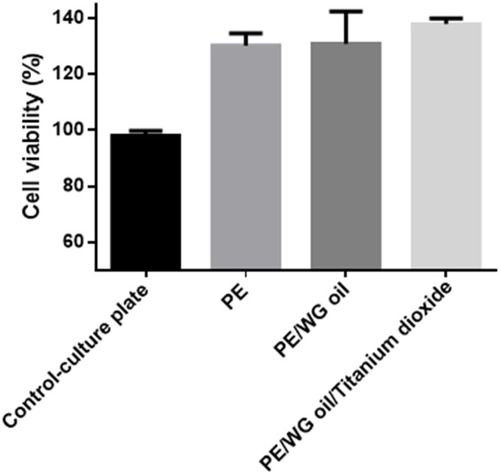
Figure 9 MTS assay of PE, PE/WG and PE/WG/TiO2. Samples with size of 0.5 cm * 0.5 cm were cut and placed in the 96 well plates. The scaffold was seeded with fibroblast cells with 10 × 103 cells/cm2 density and cultured for 5 days. After 5 days, the medium was added with 20% of MTS reagent for 4 h and optical density (OD) was measured at 490 nm.