Figures & data
Table 1 Average HA Crystal Size Of The Prepared Nanocomposite Powders*
Figure 1 Representative transmission electron microscopy images of stock dispersions of the prepared composite powders depicting the difference in HA particle structure and interaction with the CNTs (n = 3 samples/treatment for each batch); (A) Pure HA crystals; (B) p-MWCNTs-PVA; (C) f-MWCNTs-PVA; (D) p-MWCNTs-HTAB; (E) f-MWCNTs-HTAB; (F) p-MWCNTs-HTAB (closer observation). In panel (A), the arrows point to the appearance of needle-shaped particles; in panels (B–D) the arrows point to the interaction between the HA and the CNTs. Note, in panel (B) the clusters of needle like HA surrounding the CNTs. In panel (D, E), the growth of HA crystal and the CNTs shows that the crystals have not obtained the needle structure, but have a rod shape (F).
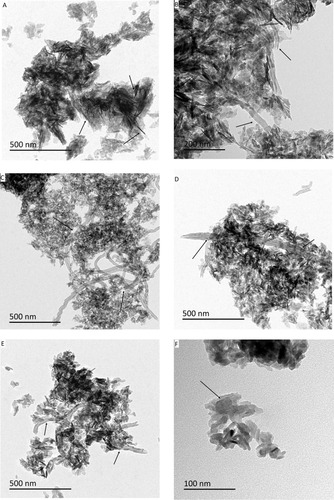
Figure 2 X-Ray Diffraction analysis of the nanocomposite powders dried from the stock dispersions prepared for transmission electron microscopy. (A) XRD peaks data for a HA certified reference material from the ICDD no. 9–432Citation;50 (B) XRD analysis of the powders: i) Pure HA control; ii) p-MWCNTs-PVA; iii) f-MWCNTs-PVA; iv) p-MWCNTs-HTAB; v) f-MWCNTs-HTAB. The peaks observed in the powders correspond to the reference HA sample from the ICDD. The spectra lines are from triplicate measurement on two batches.
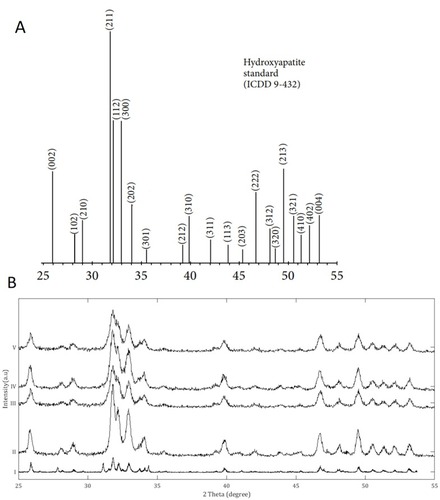
Figure 3 (A) Fourier Transform Infrared Spectroscopy analysis of the prepared powders and (B) the final composites. i) Pure HA control; ii) p-MWCNTs-PVA; iii) f-MWCNTs-PVA; iv) p-MWCNTs-HTAB; v) f-MWCNTs-HTAB; vi) PVA (reference). Arrows point to the absorbance peaks for the functional groups present in the powders and the composites. The spectra lines are from triplicate measurement on two batches.
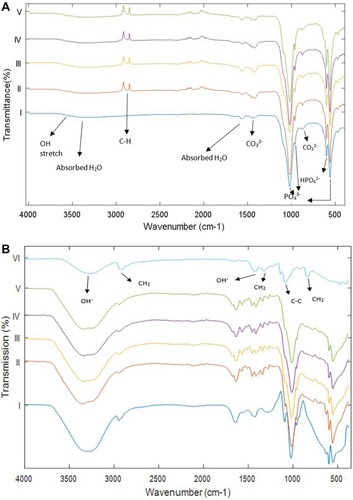
Table 2 Comparison Of The Tensile And Compressive Strength Of The Final Composites**
Figure 4 Scanning electron microscopy images of the osteoblasts in various magnifications. (A) Control cells grown on the plastic plate; (B) cells grown on pure HA as a control. It can be seen that the cells have infiltrated into the pores; (C) shows cells grown on p-MWCNTs-PVA; (D) shows cells on f-MWCNTs-PVA, note that the cells are flat and extending to cover large surfaces of the substratum; (E) shows cells on p-MWCNTs-HTAB; (F) shows cells on f-MWCNTs-HTAB. The arrows show the presence of the cells on the composites.
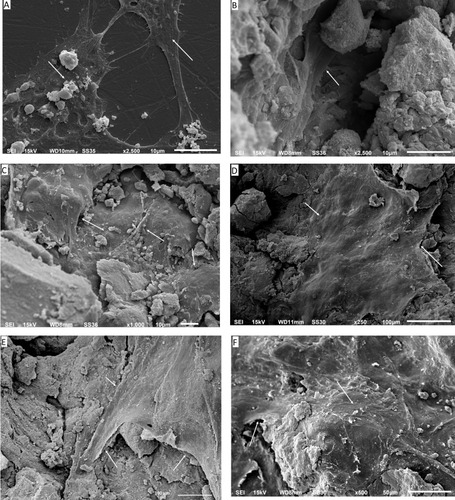
Table 3 The Total Concentration Of The Electrolytes, Na+, K+, Ca2+, P And Mg2+ In The Media After Exposing The Osteoblasts To The Composites For 7 Days And From The Cell Homogenates***
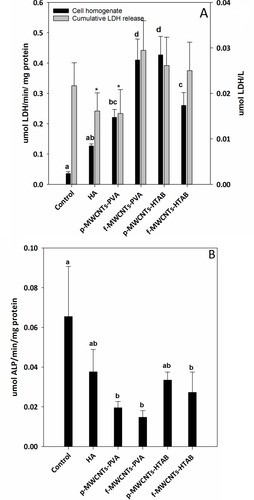
Figure 5 LDH and ALP activity release from osteoblast cells after 7 days of growth in DMEM on culture plate. (A) LDH activity released into the media, and the cell homogenate LDH activity for all the treatments and the control. (B) Alkaline phosphatase (ALP) activity from cell homogenates. Data are mean ± S.E.M (n = 6), bars with “*” indicate statistical significance and the different letter a, b, c, d indicates statistical difference from each other (one-way ANOVA, P <0.05).