Figures & data
Scheme 1 Synthesis of polynitroxylated human serum albumin-incorporated nanoflowers.
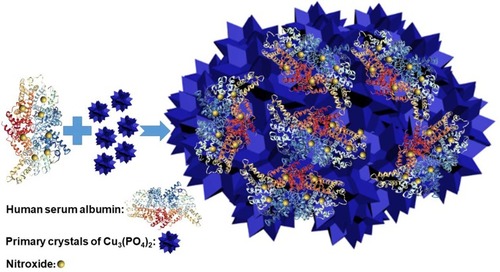
Figure 1 H2O2 depletion catalyzed by PNA-incorporated nanoflowers.
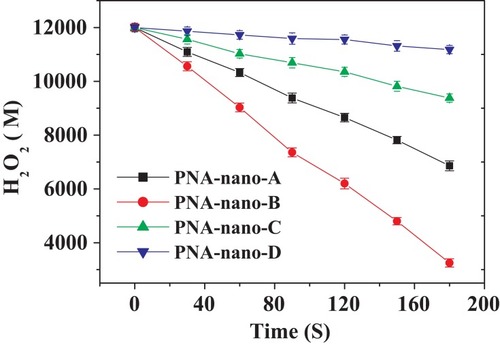
Figure 2 O2 evolution catalyzed by PNA-incorporated nanoflowers.
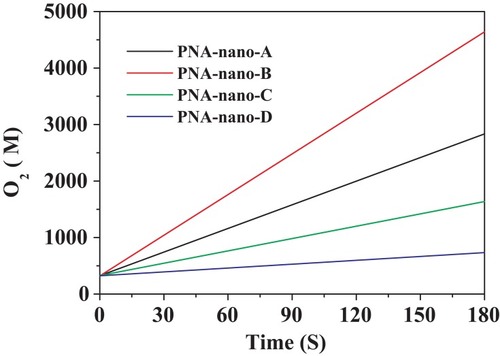
Table 1 The Specific Activity of the PNA-Incorporated Nanoflowers
Figure 3 The effect of PNA on the amount of nitroxide encapsulated into the nanoflowers.
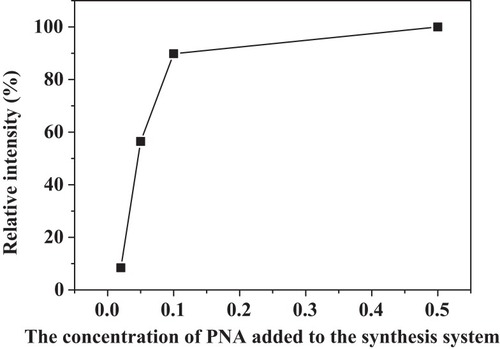
Figure 4 SEM images of the PNA-nano-A (A–D), PNA-nano-B (E–H), PNA-nano-C (I–L), and PNA-nano-D (M–P) samples.
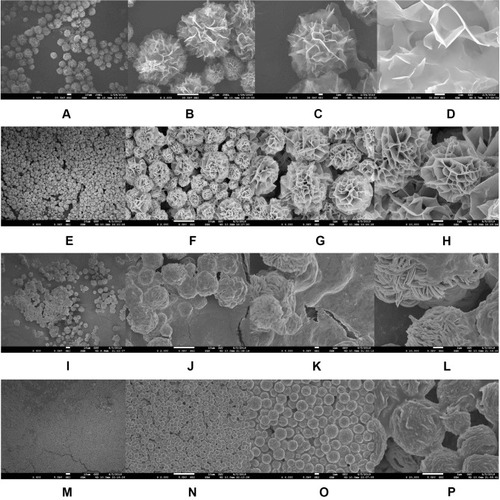
Figure 5 FTIR spectra of Cu3(PO4)2 crystal without PNA (A), the PNA-incorporated nanoflowers (B), and PNA (C).
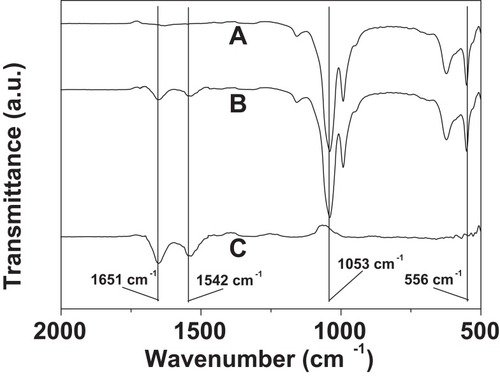
Figure 6 EPR spectra of PNA (A) and PNA-incorporated nanoflowers (B).
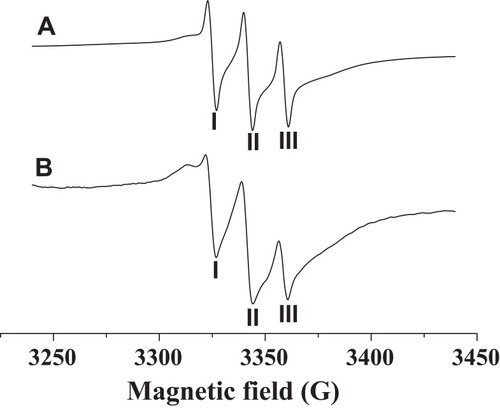
Table 2 Comparison of Kinetic Parameters Between PNA-Incorporated Nanoflowers and Native Catalase
Figure 7 Steady-state kinetic assay of the PNA-incorporated nanoflowers. Velocity indicates the rate of H2O2 depletion.
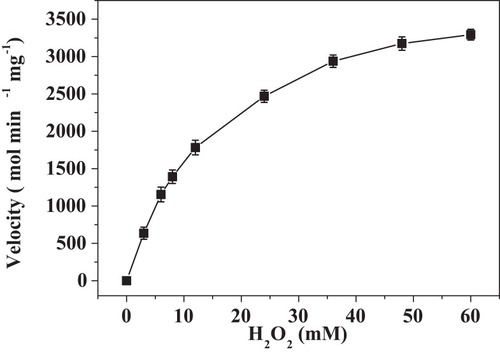
Figure 8 Steady-state kinetic assay of the PNA-incorporated nanoflowers. Velocity indicates the rate of O2 evolution.
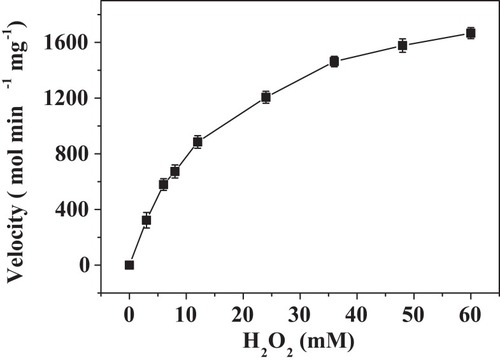
Figure 9 Lineweaver–Burk plots of the reaction velocity of the PNA-incorporated nanoflowers as a function of H2O2 concentration ranging from 3 to 60 mM. V indicates the rate of H2O2 depletion.
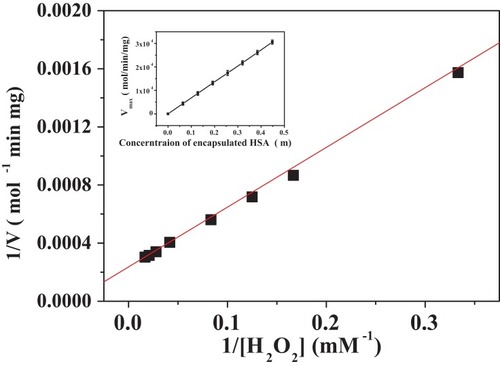
Figure 10 Lineweaver–Burk plots of the reaction velocity of the PNA-incorporated nanoflowers as a function of H2O2 concentration ranging from 3 to 60 mM. V indicates the rate of O2 evolution.
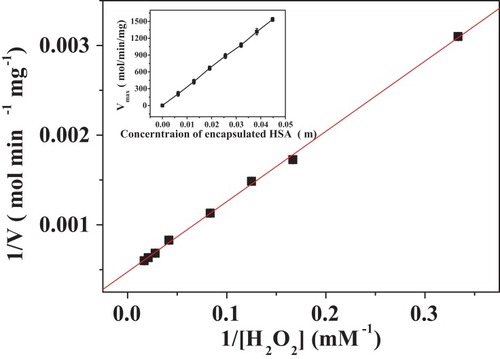
Figure 11 O2 evolution catalyzed by native catalase (1), PNA-incorporated nanoflowers (2), and HSA-incorporated nanoflowers (3). For each reaction condition, the amounts of sample used for the assay were: 10 μL native catalase (0.001 mg/mL), 50 μL PNA-incorporated nanoflowers (0.01 mg/mL), and 50 μL HSA-incorporated nanoflowers (0.01 mg/mL). One unit of activity is defined as the evolution of 1 μmol/min of oxygen at 25°C in deionized water.
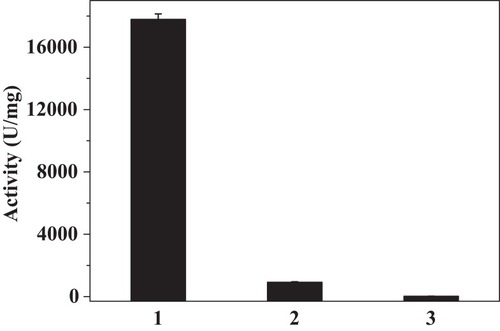
Figure 12 The catalytic mechanism of PNA-incorporated nanoflowers with dual enzyme-like activities.
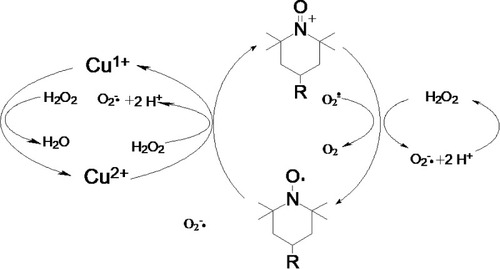
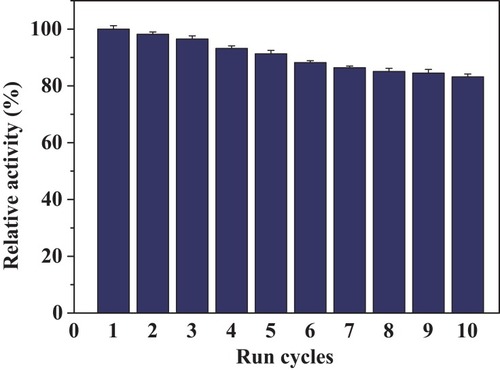
Figure 13 Reuse of PNA-incorporated nanoflowers.