Figures & data
Figure 1 Nd2O3 nanoparticles can be ingested by zebrafish. Representative confocal images are shown. (A–E) and (F–J) show Nd2O3 trajectory images in the digestive tract of two zebrafish embryos. Black arrows indicate the Nd2O3 particles. Whole time-lapse imaging can be seen in Supplementary Movie S1.
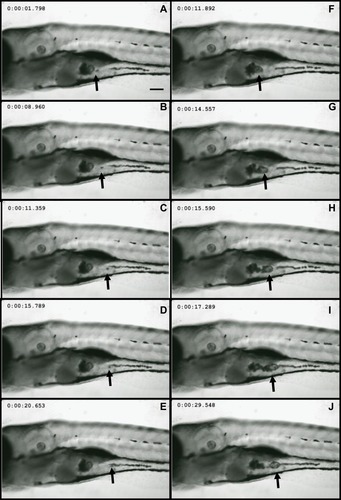
Figure 2 Effects of Nd2O3 on the mortality and malformation of larvae at 120 hpf. (A) The mortality of the larvae increased in a dose-dependent manner. Compared with the 0 ug/mL group. ***P≤0.001 (Student t test). (B) The percentage of abnormal embryos treated with Nd2O3. These experiments were repeated at least 3 times. (C) Light microscope image of zebrafish wild-type (WT) embryos at 5 dpf. (D–G) Light microscope images of embryos treated with Nd2O3 at 5 dpf. Black arrows indicate bent tail. White arrows indicate cardiac oedema.
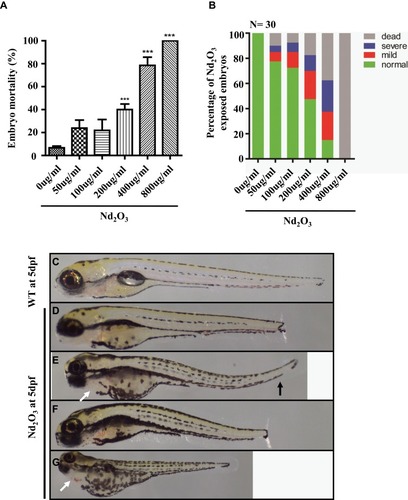
Figure 3 Nd2O3 contributed to reduced heart rate and arrhythmia in zebrafish embryos. (A) Quantitative analysis of heart rate at 5 dpf. Compared with the 0 ug/mL group. **P≤0.01. (B) Representative results of heart rate analysis. (C) Representative results of arrhythmia analysis of Nd2O3 exposed embryo. Whole time-lapse imaging can be seen in Supplementary Movies S2–S5.
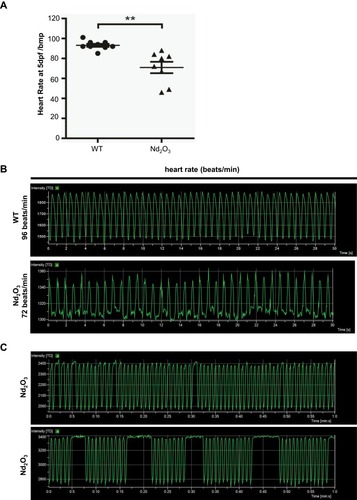
Figure 4 Nd2O3 disturbed the development of cerebrovascular at 5 dpf. (A, B, B’) The cerebrovascular images of wild-type embryo. (C, D, D’) The cerebrovascular images of embryos exposed to Nd2O3 (100 μg/mL). (E, F, F’) The cerebrovascular images of embryos exposed to Nd2O3 (200 μg/mL). Whole time-lapse imaging can be seen in Supplementary Movies S6–7. Scale bars, 100 μm.
Abbreviations: PrA, prosencephalic artery (white arrow); ACeV, anterior (rostral) cerebral vein (white arrowhead); MCeV, middle cerebral vein (yellow arrowhead); CtA, central artery (red arrow); PCeV, posterior (caudal) cerebral vein (red arrowhead); PHBC, primordial hindbrain channel (red arrowhead); MMCtA, middle mesencephalic central artery (yellow arrow); MtA, metencephalic artery (yellow arrow).
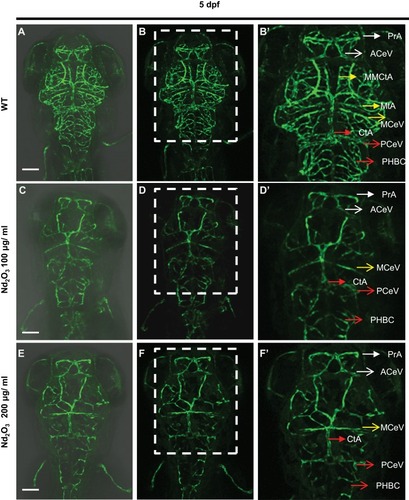
Figure 5 Nd2O3 disturbed vascular sprouting at 3 dpf. (A–C) The cerebrovascular images of wild-type embryo. (D–F) The cerebrovascular images of embryos exposed to Nd2O3 (100 μg/mL). (G–I) The cerebrovascular images of embryos exposed to Nd2O3 (200 μg/mL). Whole Z-steps lapse imaging can be seen in Supplementary Movies S8, S9 and S10. Scale bars, 100 μm.
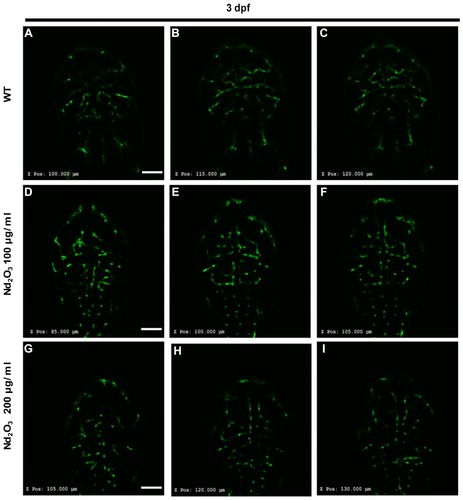
Figure 6 The autophagy level was checked in Nd2O3 treated embryos. (A) Immunoblot analysis with autophagy marker Lc3. (B–J) Representative confocal images of mCherry–Lc3 puncta (autophagosomes) in Tg(Flk1:EGFP) live embryos. (K) Quantitative results were summarised in (B–J). mCherry–Lc3 puncta were counted in EGFP+ cells in 7–10 individual embryos. Error bars in (K) represent standard error of the mean (SEM). **P≤0.01 (Student’s t-test). Scale bars, 100 μm.
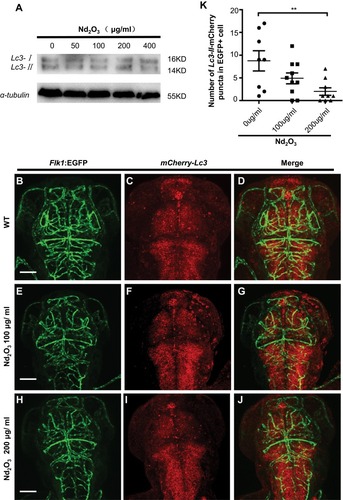
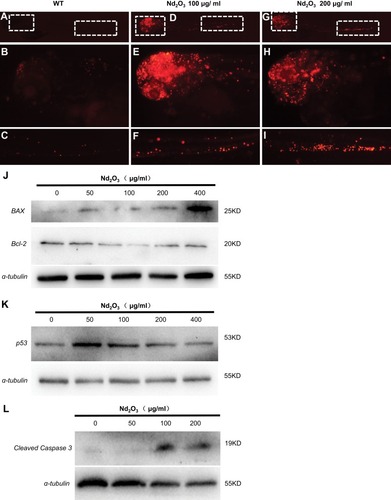
Figure 7 The apoptosis pathway was activated in Nd2O3-treated embryos. (A–I) The TUNEL staining of Nd2O3-treated embryos. (A–C) Representative images of WT embryos are shown. (D–F) Representative images of 100 μg/mL Nd2O3 treated embryos are shown. (G–I) Representative images of 200μg/mL Nd2O3-treated embryos are shown. (J) Immunoblot analysis with apoptosis marker Bax and Bcl-2. (K) Immunoblot analysis with apoptosis marker p53. (L) Immunoblot analysis with apoptosis marker cleaved caspase 3.