Figures & data
Figure 1 Characterization of PNPs. (A) Schematic design of PNPs and the interaction of membrane protein with vWF, Collagen and Fibrin. (B) Transmission electron micrographs of PNPs. (C) Size of PLGA cores, PNPs and NPs (n=4). (D) Zeta potential of PLGA cores, PNPs and NPs (n=4). (E) Particle diameter of PNPs in water on day 0 and day 7 (n=4). (F) TEM image of PNPs primary stained with anti-GP VI, and secondary stained by an immunogold conjugate. (G) Protein content visualization of platelet vesicles and PNPs running on SDS-PAGE at equivalent protein concentrations followed by Coomassie staining and Western blotting analysis of platelet vesicles and PNPs for characteristic platelet membrane markers. All samples were run at equivalent protein concentrations. (H) Flow cytometry analysis validated similar platelets glycoproteins. All bars represent means ± s.d.
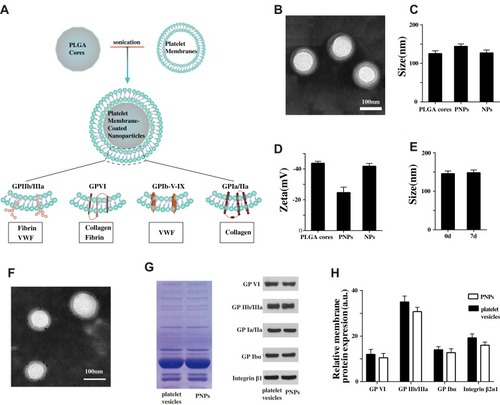
Figure 2 Mimicking the platelets adhesive function of PNPs via vWF in vitro. (A) Schematic design of parallel flow circular chamber study of vWF. (B) Representative fluorescent microscopic images showing the binding of PNPs (red) to vWF (green) under varying shear stresses, and PBS, NPs and PNPs incubating with antibodies (PNPs + Ab) at 0 shear rates. (C) Normalized nanoparticle bound intensity under different shear rates. The PNPs bound intensity at 0 shear rates was arbitrarily set at 100%. *p<0.001 compared with any other group under the same stress shear. All bars represent means ± s.d.
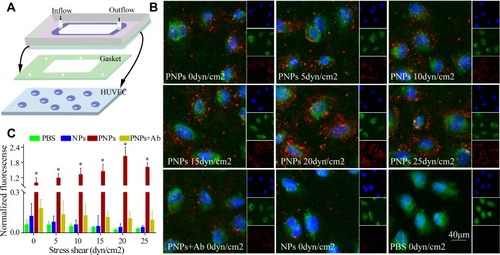
Figure 3 Mimicking the platelets adhesive function of PNPs via collagen in vitro. (A) Schematic design of parallel flow circular chamber study of collagen. (B) Representative fluorescent microscopic images showing the binding of PNPs (red) to collagen (green) under varying shear stresses, and PBS, NPs and PNPs incubating with antibodies (PNPs + Ab) at 0 shear rates. (C) Normalized nanoparticle bound intensity under different shear rates. The PNPs bound intensity at 0 shear rates was arbitrarily set at 100%. *p<0.001 compared with any other group under the same stress shear. All bars represent means ± s.d.
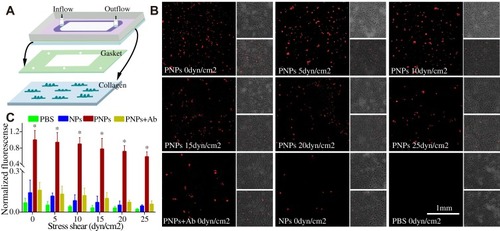
Figure 4 Mimicking the platelets adhesive function of PNPs via fibrin in vitro. (A) Schematic design of parallel flow circular chamber study of fibrin. (B) Representative fluorescent microscopic images showing the binding of PNPs (red) to fibrin (green) under varying shear stresses, and PBS, NPs and PNPs incubating with antibodies (PNPs + Ab) at 0 shear rates. (C) Normalized nanoparticle bound intensity under different shear rates. The PNPs bound intensity at 0 shear rates was arbitrarily set at 100%. *p<0.001 compared with any other group under the same stress shear. All bars represent means ± s.d. #p<0.01 compared with PBS group.
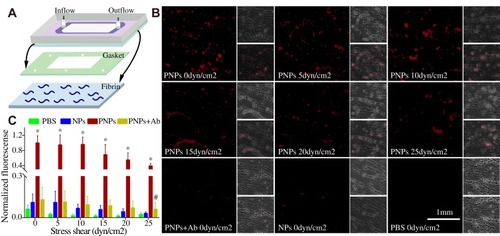
Figure 5 Proof of sclerosis. Representative Doppler images of ApoE−/− mice (A), C57 mice (B) and quantitative results of transaortic valve flow velocity (C). Δ p<0.001. (D) Representative aortic valve sections and quantitative results of thickness, calcification, and destroyed endothelial integrity. Δp<0.01.
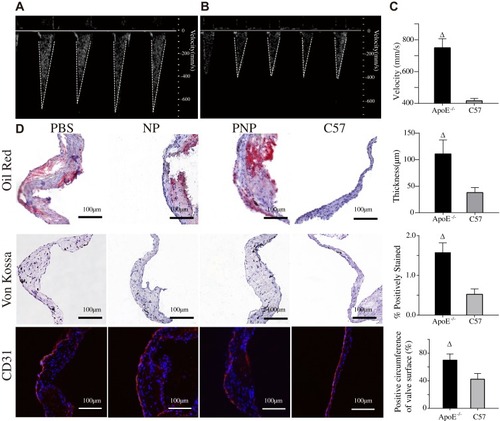
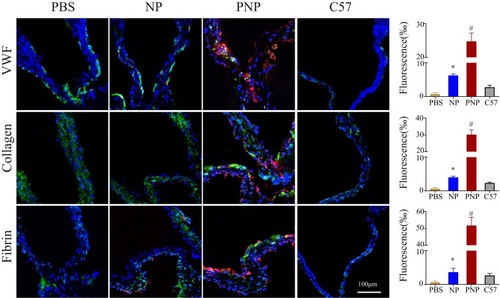
Figure 6 PNPs accumulation in sclerotic aortic valves of ApoE−/− mice in vivo. The representative fluorescent microscopic images and quantitative results of fluorescence which confirmed the enhanced PNPs (red) targeting to sclerotic aortic valves and co-localization with vWF, collagen and fibrin in ApoE−/− mice. *p<0.01 compared with PBS group, #p<0.01 compared with any other group. All bars represent means ± s.d.