Figures & data
Figure 1 Triblock copolymer micelles loaded with VP exhibit tunable morphology, pH-sensitivity, and aqueous solubility. (A) Representative TEM images of both sVPM (left, scale bar= 100 nm) and fVPM (right, scale bar= 500 nm), (B) size and polydispersity index (PDI) of micelles (n=3, mean ± SD), (C) zeta potential of sVPM and fVPM in 10 mM NaCl, (D) turbidity measured with both free and encapsulated VP in fVPM at 2 mg/mL VP in 1× PBS (n=3, mean ± SD), (E) VP release from fVPM at 0, 1, 3, 5, and 10 hrs timepoints in buffers prepared at pH 5.0, 6.5, and 7.4 (n=3, mean ± SD, one-way ANOVA with Bonferroni’s multiple comparisons test (**p ≤ 0.01, ***p ≤ 0.001)).
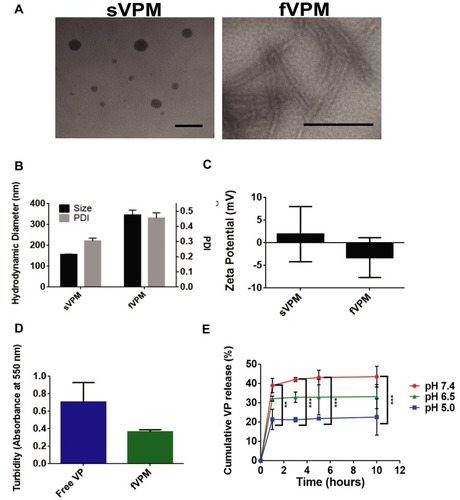
Table 1 Summarized Chemical and Physical Characteristics of sVPM and fVPM
Figure 2 NHA demonstrate significantly lower uptake efficiency and normalized geometric mean uptake of free VP, sVPM, and fVPM compared to patient-derived GBMs. (A) Consolidated uptake efficiency data from all three cell types and treatments at 7.8, 15.6, and 31.3 nM (n=4, mean ± SD, one-way ANOVA with Bonferroni’s multiple comparisons test (**p ≤ 0.01, ****p≤ 0.0001)). (B and C) Consolidated normalized geometric mean measurements at 62.5 nM (B) and 125 nM (C) VP treatment for all three tested cell types (n=4, mean ± SD, one-way ANOVA with Bonferroni’s multiple comparisons test (*p ≤ 0.05, **p ≤ 0.01, ***p ≤ 0.001, ****p ≤ 0.0001)). Cells were normalized to untreated controls of the same cell type.
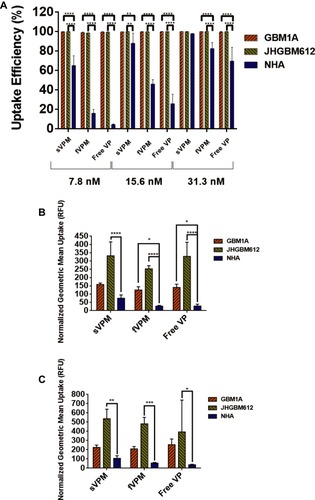
Figure 3 NHA viability is significantly greater than patient-derived GBMs after free VP, sVPM, and fVPM treatments. (A–C) Representative brightfield images for corresponding cell types after 62.5 nM VP (left), 125 nM VP (center) and no treatment (right) (scale bar = 100 µm). (D and E) Consolidated normalized cell viability measurements at 62.5 nM (D) and 125 nM (E) VP treatment for all three tested cell types (n=4, mean ± SD, one-way ANOVA with Bonferroni’s multiple comparisons test (****p ≤ 0.0001)). Cells were normalized to untreated controls of the same cell type.
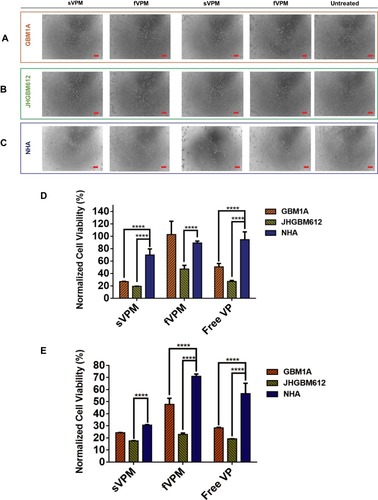
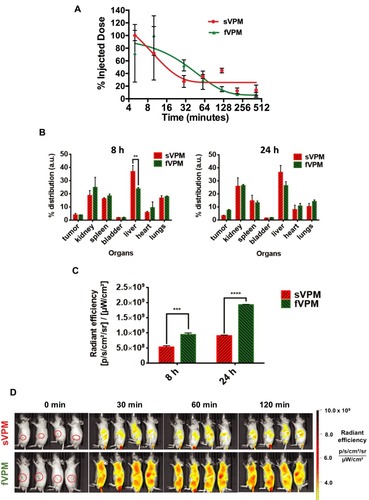
Figure 4 fVPM exhibit enhanced pharmacokinetic properties compared to sVPM in an ectopic human GBM tumor mouse flank model. (A) sVPM and fVPM in blood at 5, 10, 30, 60, 120, 210, and 420 min timepoints, (B) 8 hrs and 24 hrs biodistribution for tumors and major organs (n=2, mean ± SD, one-way ANOVA with Bonferroni’s multiple comparisons test (**p ≤ 0.01)). (C) Nanoparticle signal in tumors after 8 and 24 hrs (n=2, mean ± SD, one-way ANOVA with Bonferroni’s multiple comparisons test (***p ≤ 0.001, ****p ≤ 0.0001)). (D) sVPM and fVPM- treated animals under IVIS after 0 min, 30 mins, 60 mins, and 120 mins. Animals in the same image are replicates. Red circles in leftmost panels indicate the location of tumors.