Figures & data
Figure 1 XRD patterns: (A) low degree at 0-10° for MSN, Zn-MSN, and CGZM-bio; (B) high degree at 10-80° for Zn-MSN, and CGZM-bio.
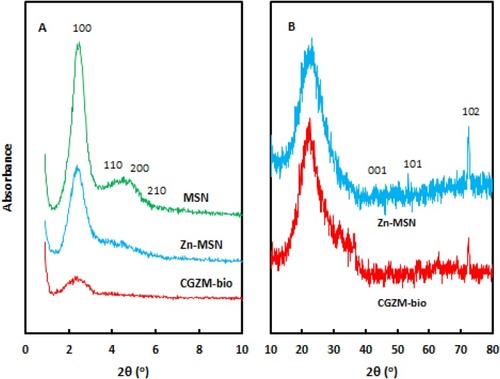
Figure 2 (A) Nitrogen sorption isotherms and (B) pore size distribution for the MSN, Zn-MSN NPs, and CGZM-bio samples.
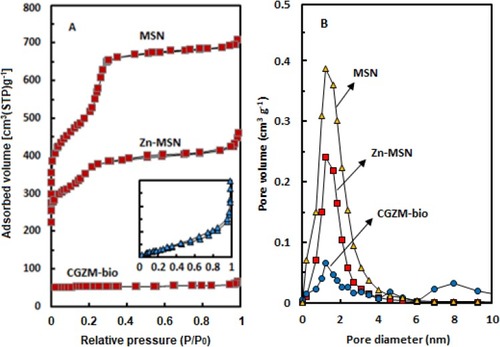
Table 1 Physical Characteristics of the MSN, Zn-MSN NPs and CGZM-Bio Samples
Figure 3 SEM and TEM images of the (A, D) MSN, (B, E) Zn-MSN NPs, (C, F) CGZM-bio samples.
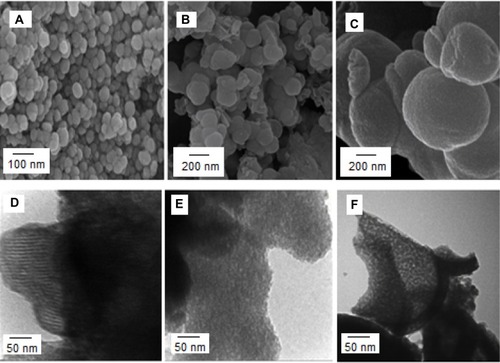
Figure 4 Energy-dispersive X-ray spectroscopy of the Zn-MSN sample.
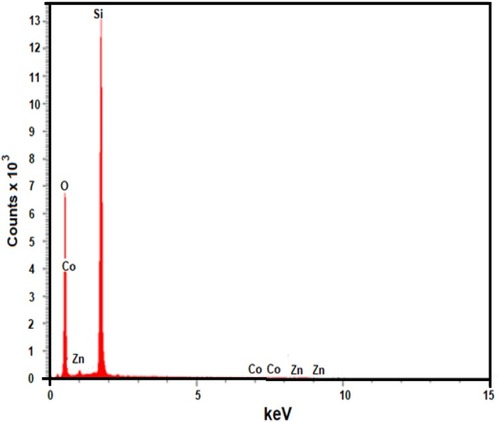
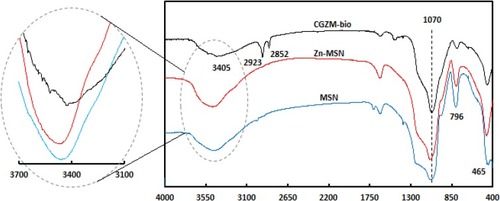
Figure 5 FTIR spectra of MSN, Zn-MSN NPs, and CGZM-bio in the region of 400–4000 cm−1.
Scheme 1 Proposed structure for CGZM-biocomposite.
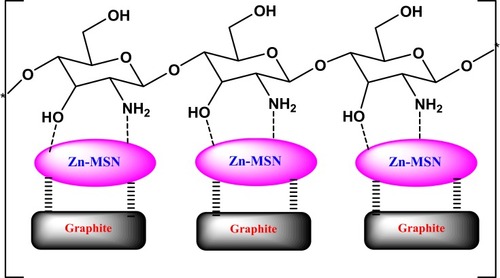
Table 2 IZD, MIC and MBC of the Zn-MSN NPs and CGZM-Bio Samples
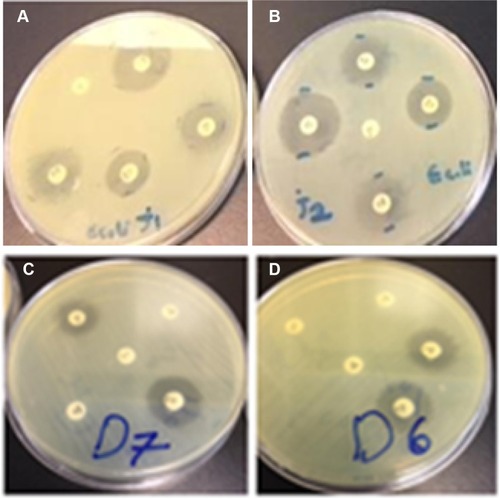
Figure 6 Images of the antibacterial tests against E. coli for (A) 5 µg/mL of CGZM-bio, (B) 10 µg/mL Zn-MSN, and the antibacterial tests against S. aureus for 10 µg/mL (C) CGZM-bio, and (D) Zn-MSN.