Figures & data
Figure 1 Synthesis and physical characteristics of p66shc siRNA-encapsulated PLGA NPs.
Notes: (A) To prepare PLGA nanoparticles, 200 μL of 20 μM siRNA in TE7.5 buffer was added, on a drop-by-drop basis, to 800 μL of dichloromethane (DCM) containing 25 mg of PLGA (Corbion, Amsterdam, the Netherlands) and emulsified by sonication into a primary W1/O emulsion. Next, 2 mL of 2% PVA1500 (w/v) was added directly into the primary emulsion and further emulsified by sonication to form a W1/O/W2 double emulsion. The resulting product was then diluted with 6 mL of 2% PVA1500 and stirred magnetically for 3 h at room temperature to evaporate DCM. The resulting PLGA nanoparticles were collected by ultracentrifugation at 38,000 g for 10 min at 4°C, washed twice with deionized RNAase free-water, resuspended in water and finally freeze-dried. (B) Nanoparticles were assessed by the scanning electron microscope. Scale bar = 200 nm. (C, D) p66shc si_NPs were dissolved in water and measured for size and zeta potential using the Zetasizer Nano ZS90 (Size = 183.7 ± 72.21, Zeta potential = 41.1 ± 4.81). (E) siRNA release assay of nanoparticles in PBS showed the cumulative percentages of siRNA released from nanoparticles based on different matrices as a function of time.
Abbreviation: PLGA, poly(lactic-co-glycolic acid).
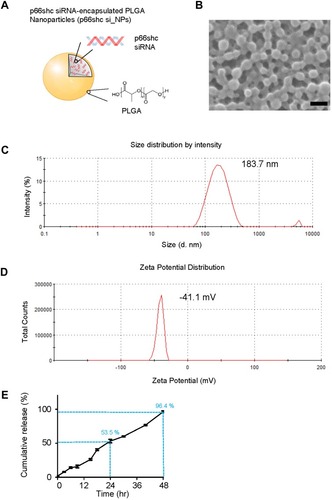
Figure 2 Expression of p66shc in articular cartilage from OA patients and MIA-induced rat models.
Notes: (A, B) p-p66shc was prominently expressed at sites of injury. Scale bar = 50 µm. ***P < 0.001 (C, D) p-p66shc and total shc protein levels were detected via Western blotting, and the p-p66shc/ACTB ratios were determined using Image J software. (E, F) Expression levels of p66shc in knee cartilage as measured with immunohistochemical staining. Protein density was quantified using Image J software (NIH, USA). Scale bar = 50 µm. **P < 0.01.
Abbreviations: OA, osteoarthritis; MIA, monosodium iodoacetate; ACTB, actin beta.
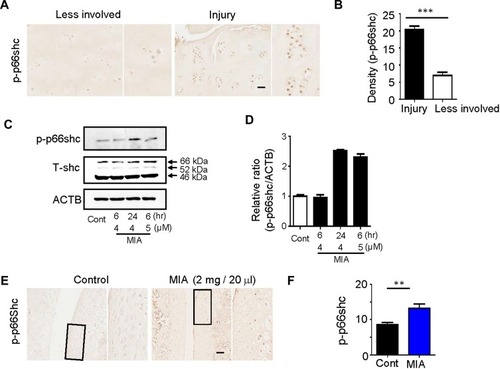
Figure 3 MIA caused mitochondrial dysfunction and ROS production, and inhibition of p66shc alleviated MIA-induced mtROS production in human chondrocytes.
Notes: (A, B) Extent of cytotoxicity following MIA treatment, according to time and dose. (C, D) The oxygen consumption rate (OCR), which reflects mitochondrial function, and the extracellular acidification rate (ECAR), which indicates lactate production, were obtained using a Seahorse XF24 analyzer in cells treated with 2 µg/mL oligomycin (an ATPase inhibitor), 5 µM cyanide m-chlorophenylhydrazone (CCCP; an uncoupler), or 2 µM rotenone (a mitochondrial complex I inhibitor). Area under the curve (AUC) for basal OCR and ECAR were measured from the first to the third timepoints. The AUC for maximal OCR was measured from the seventh to the ninth timepoints. Data represent the mean ± SEM (error bars) of three experiments. **P < 0.01, ***P < 0.001 (derived via one-way ANOVA); MIA vs control. (E) MitoSOX fluorescence imaging of human chondrocytes expressing Ad/LacZ and Ad/sh-p66shc. (F) Quantification of MitoSOX fluorescence. (G) Schematic diagram of p66shc-related pathway.
Abbreviation: ROS, reactive oxygen species.
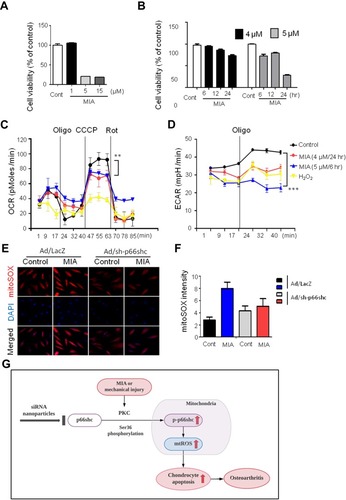
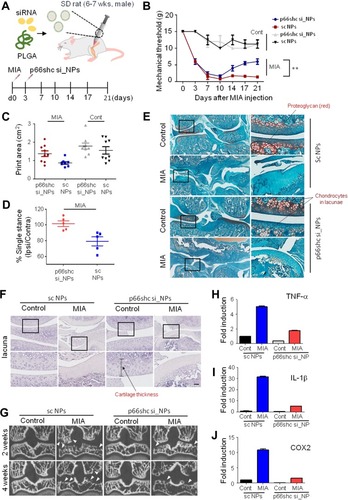
Figure 4 P66shc deficiency attenuates pain behavior, cartilage damage, and inflammation in MIA-induced OA animal model knee joints.
Notes: (A) Schematic of protocol for injecting p66shc siRNA encapsulated in poly(lactic-co-glycolic acid) (PLGA) nanoparticles (NPs) (p66shc si_PLGA NPs) into rats with MIA-induced OA. PLGA NPs containing scrambled siRNA or p66shc si_PLGA NPs were delivered to the knee using a Hamilton syringe. (B) Rats were subjected to behavioral testing using Von Frey filaments (n = 7–8 per group). **P < 0.01 (C) Paw print areas of the legs with MIA-injected knees, as assessed by CatWalk analysis. (D) The percentage (ipsi-/contra-lateral single standing) of ipsilateral paw single standing was measured in MIA-injected rats treated with p66shc si_PLGA NPs. (E) Safranin-O and Fast Green staining of knee joints from rats treated with MIA for 3 weeks. (Scale bar = 50 µm) The intensity of Safranin O staining is proportional to the proteoglycan content in the cartilage tissue. (F) Hematoxylin staining of paraffin-embedded sections of the knee joint. (Scale bar = 50 µm) (G) Representative transverse CT images of tibial subchondral bony destruction (arrowheads) at 3 weeks after injection with p66shc si_PLGA NPs. (H–J) Expression levels of tumor necrosis factor (TNF)-α (H), interleukin (IL)-1β (I), and cyclooxygenase 2 (COX2) (J) by qRT-PCR. Total mRNA was isolated from rat knee cartilage. Scale bar = 50 µm.
Abbreviations: PLGA, poly(lactic-co-glycolic acid); NPs, nanoparticles.