Figures & data
Figure 1 XRD (A), FTIR (B) and XPS (C) of PC, PCP and PCPS.
Abbreviations: XRD, X-ray diffraction; FTIR, Fourier transform infrared spectrometry; XPS, X-ray photoelectron spectroscopy; PC, polyetheretherketone/nano magnesium silicate composite; PCP, PC treated by particle impact; PCPS, PCP treated by concentrated sulfuric acid.
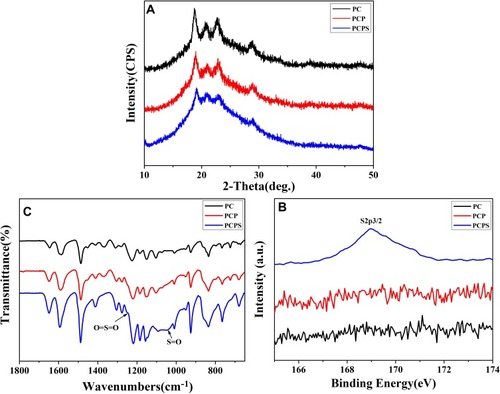
Figure 2 SEM photographs of surface morphology of PC (A, B), PCP (C, D) and PCPS (E–H) under different magnifications.
Abbreviations: SEM, scanning electron microscope; PC, polyetheretherketone/nano magnesium silicate composite; PCP, PC treated by particle impact; PCPS, PCP treated by concentrated sulfuric acid.
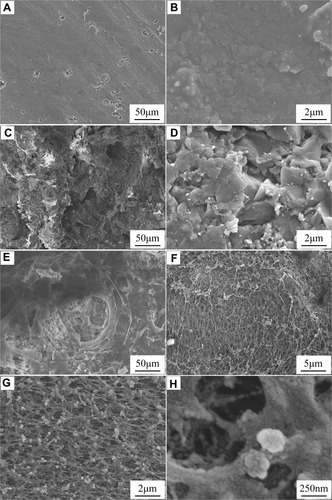
Figure 3 EDS spectra of PCP (A) and PCPS (B), and EDS mapping of Mg (C), Si (D) and S (E) elements distribution on PCPS surface.
Abbreviations: EDS, energy dispersive spectrometer; PC, polyetheretherketone/nano magnesium silicate composite; PCP, PC treated by particle impact; PCPS, PCP treated by concentrated sulfuric acid; Mg, magnesium; Si, silicon; S, sulfur.
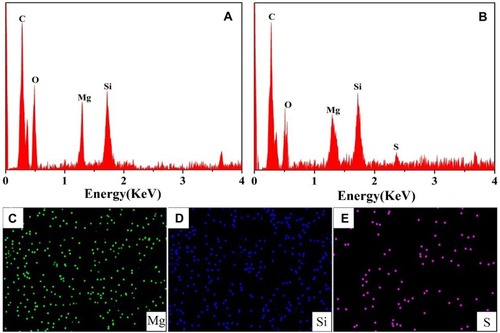
Figure 4 Laser microscope 3D photographs of surface morphology of PC (A), PCP (B) and PCPS (C), and surface roughness (D) and water contact angles (E) of PC, PCP and PCPS (*represents p<0.05, PCPS vs PC, PCP vs PC; #represents p<0.05, PCPS vs PCP).
Abbreviations: PC, polyetheretherketone/nano magnesium silicate composite; PCP, PC treated by particle impact; PCPS, PCP treated by concentrated sulfuric acid.
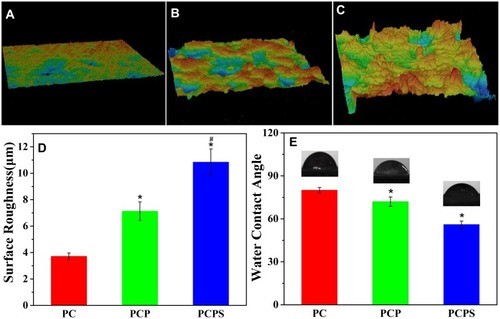
Figure 5 SEM photographs of surface morphology of PC (A), PCP (B) and PCPS (C) soaked into SBF for 7 days, and EDS spectra of deposits on PC (D), PCP (E) and PCPS (F) surface.
Abbreviations: SEM, scanning electron microscope; PC, polyetheretherketone/nano magnesium silicate composite; PCP, PC treated by particle impact; PCPS, PCP treated by concentrated sulfuric acid; SBF, simulated body fluid; EDS, energy dispersive spectrometer.
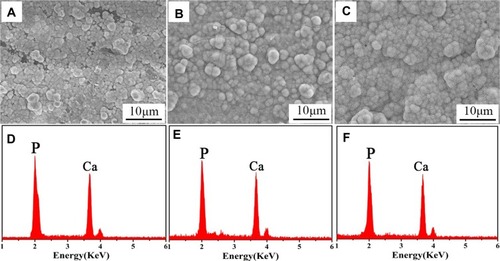
Figure 6 Antibacterial properties of PC, PCP and PCPS: (A) E. coli and S. aureus cultured on the samples (the dilution factor of bacterial suspension seeded on the agar plates for each sample was 100). Percentage reduction: (B) E. coli and (C) S. aureus (*represents p<0.05, PCPS vs PC; #represents p<0.05, PCPS vs PCP).
Abbreviations: PC, polyetheretherketone/nano magnesium silicate composite; PCP, PC treated by particle impact; PCPS, PCP treated by concentrated sulfuric acid; E. coli, Escherichia coli; S. aureus, Staphyloccocus aureus.
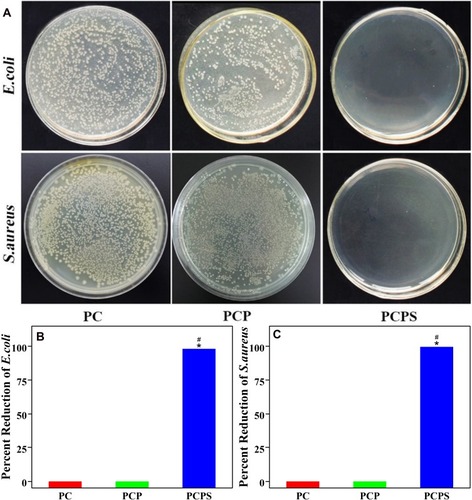
Figure 7 CLSM photographs of morphology of BMSC on PC (A, D), PCP (B, E) and PCPS (C, F) for 12 (A–C) and 24 hours (D–F).
Abbreviations: CLSM, confocal laser scanning microscopy; BMSC, bone marrow mesenchymal stem cells; PC, polyetheretherketone/nano magnesium silicate composite; PCP, PC treated by particle impact; PCPS, PCP treated by concentrated sulfuric acid.
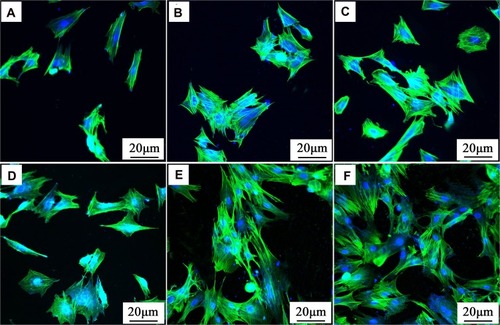
Figure 8 SEM photographs of morphology of BMSC on PC (A, D), PCP (B, E) and PCPS (C, F) after cultured for 3 (A–C) and 7 days (D–F).
Abbreviations: SEM, scanning electron microscope; BMSC, bone marrow mesenchymal stem cells; PC, polyetheretherketone/nano magnesium silicate composite; PCP, PC treated by particle impact; PCPS, PCP treated by concentrated sulfuric acid.
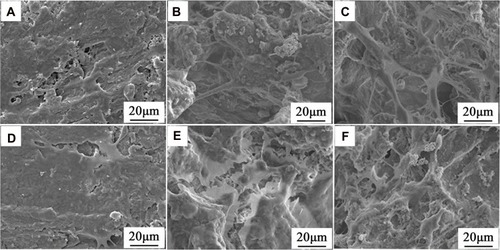
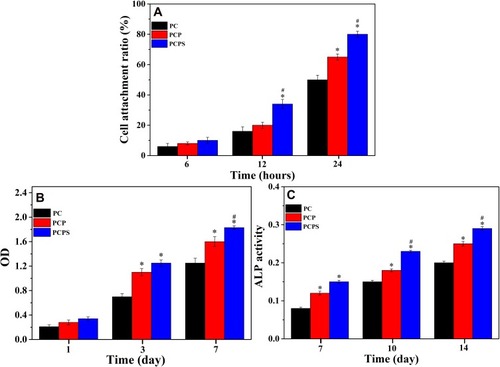
Figure 9 Attachment ratio (A), optical density (B) and ALP activity (C) of BMSC on PC, PCP and PCPS for different days (*represents p<0.05, PCPS vs PC, PCP vs PC; #represents p<0.05, PCPS vs PCP).
Abbreviations: OD, optical density; ALP, alkaline phosphatase; BMSC, bone marrow mesenchymal stem cells; PC, polyetheretherketone/nano magnesium silicate composite; PCP, PC treated by particle impact; PCPS, PCP treated by concentrated sulfuric acid.