Figures & data
Figure 1 Photographs of (A) PLC mesh, (B) PLGA composite nanofibers, and (C) PLGA-PCL composites.
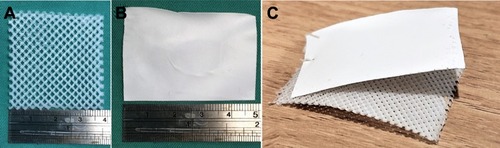
Figure 2 SEM image and fiber diameter distribution of (A) pure PLGA nanofibers, (B) sheath-core PLGA/BMP-2 nanofibers, and (C) PLGA/vancomycin/ceftazidime nanofibers.
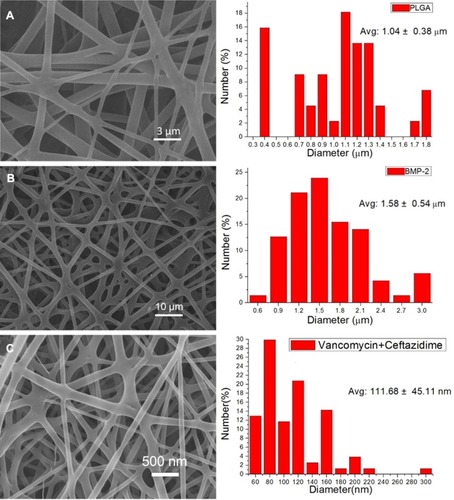
Figure 3 Transmission electron microscopy image of sheath-core nanofibers.
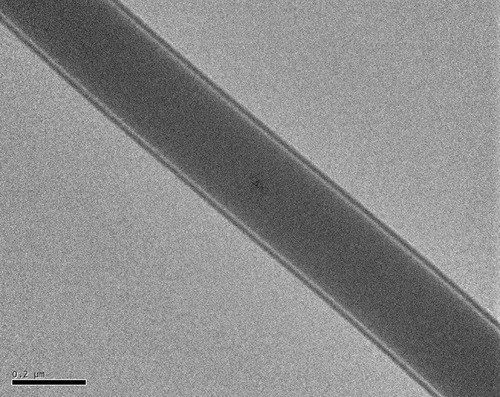
Figure 4 Water contact angles of (A) pure PLGA nanofibers (126.24 ± 10.26°), (B) sheath-core PLGA/BMP-2 nanofibers (120.00 ± 8.67°), and (C) PLGA/vancomycin/ceftazidime nanofibers (69.2.33 ± 5.14°). Substantially improved hydrophilicity of electrospun nanofibers was observed with the addition of water-soluble antibiotics.
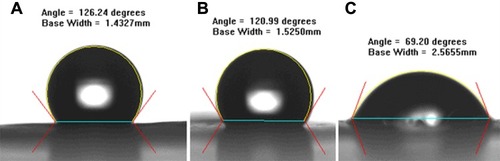
Figure 5 In vitro drug release profiles. (A) Daily and (B) accumulated release of antibiotics from the composite nanofibers. (C) Daily and (D) accumulated release of BMP-2 from the composite nanofibers. In vivo examination of the daily release of (E) antibiotics and (F) BMP-2 from the composite scaffold in the muscular tissue.
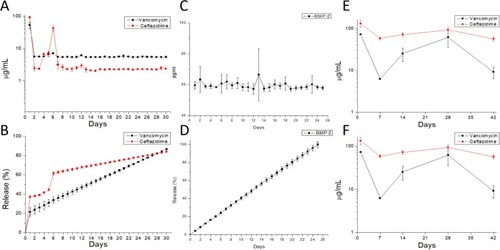
Figure 6 Analysis of the gross specimen (A) revealed a thick induced membrane (IM) formed circumferentially around the applied scaffold. The PLGA nanofibers had been dissolved completely, and only the PCL mesh was preserved. The histological evaluation of the induced membrane was performed (blue arrow) and represents in (B). (B) Histological evaluation by hematoxylin and eosin staining of the induced membrane. Radiographic examination of fracture healing in (C) the PCL group, (D) the PCL-PLGA/antibiotic group, and (E) the PCL-PLGA/antibiotic/BMP-2 group.
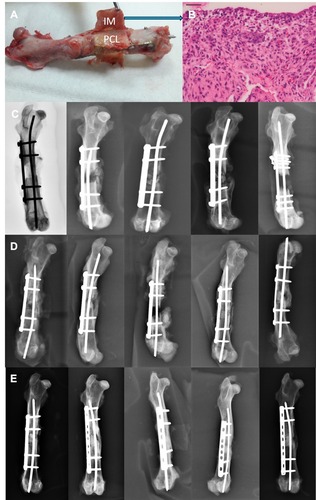
Figure 7 Immunohistochemical analysis of the expression of (A) BMP-2 (*membrane-lining cells, †spindle cells), (B) TGF-β (*membrane-lining cells, †spindle cells), (C) vWF, (D) VEGF, and (E) IL-6.
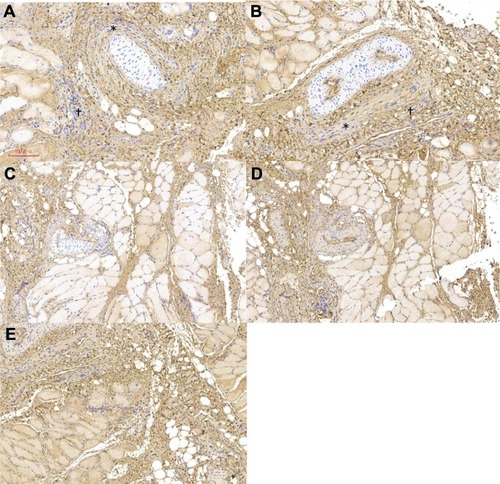
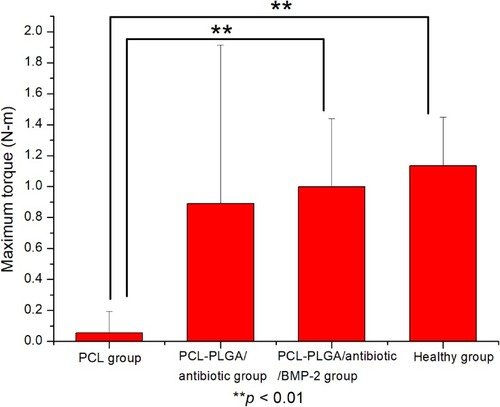
Figure 8 Maximum torques of healed bone in the Masquelet procedure.