
Figures & data

Figure 1 Following intravenous injection, FH SPIONs slowly extravasate from vascular space to interstitial space, from where they can be taken up by immune cells (monocytes/macrophages) and delivered via lymphatic vessels to lymph nodes. The FH SPIONs remain in normal nodal tissue and reduce MRI signal intensity, thereby enhancing contrast against any metastatic lesions in the node.
Abbreviations: FH, Feraheme; SPIONs, superparamagnetic iron oxide nanoparticles.
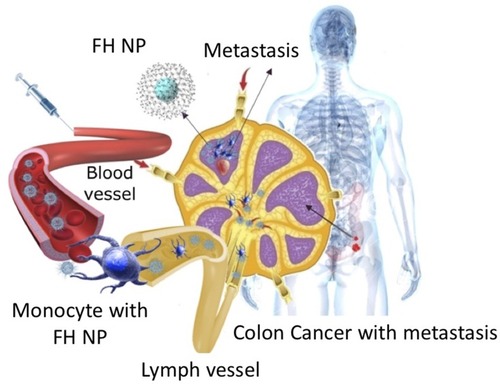
Table 1 Summary of 89Zr-FH Dilutions in Phantom Vials Prepared for PET-MR Imaging
Figure 2 PET-MR imaging phantoms.
Notes: Phantom vials (11.6 mm × 32 mm, V = 1.8 mL) containing [89Zr]Zr-FH dilutions with varying FH Fe concentrations and [89Zr]Zr initial activities prepared for simultaneous PET-MR imaging.
Abbreviations: PET, positron emission tomography; MR, magnetic resonance; FH, Feraheme.
![Figure 2 PET-MR imaging phantoms.Notes: Phantom vials (11.6 mm × 32 mm, V = 1.8 mL) containing [89Zr]Zr-FH dilutions with varying FH Fe concentrations and [89Zr]Zr initial activities prepared for simultaneous PET-MR imaging.Abbreviations: PET, positron emission tomography; MR, magnetic resonance; FH, Feraheme.](/cms/asset/175a4a05-1ca4-42dd-9e71-5e9e54ac46a1/dijn_a_12194528_f0002_c.jpg)
Figure 3 TEM images of FH and corresponding transmission line profiles. (A) unlabeled FH (UL-FH) and (B) [90Zr]Zr –labeled FH (L-FH) (scale bar is 20 nm); (C) average transmission profile of FH in each image.
Abbreviations: TEM, transmission electron microscopy; FH, Feraheme.
![Figure 3 TEM images of FH and corresponding transmission line profiles. (A) unlabeled FH (UL-FH) and (B) [90Zr]Zr –labeled FH (L-FH) (scale bar is 20 nm); (C) average transmission profile of FH in each image.Abbreviations: TEM, transmission electron microscopy; FH, Feraheme.](/cms/asset/e81ef380-bec8-46eb-9a9e-98bf68dd1f2e/dijn_a_12194528_f0003_c.jpg)
Figure 4 Relaxometric map for MR imaging of FH at different TE and TR. White-gray area indicates positive contrast relative to water, darker gray indicates negative contrast. The black and white circles indicate the parameters used to obtain. and
Abbreviations: MR, magnetic resonance; TE, echo time; TR, repetition time; SNR, signal-to-noise ratio; T1W, T1 weighted; T2W, T2 weighted.
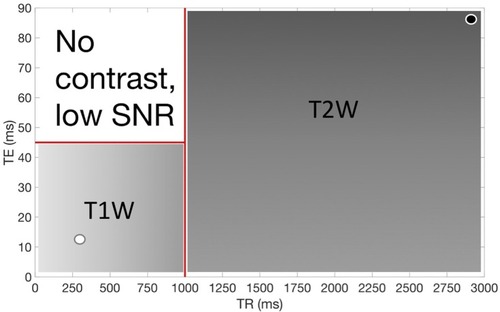
Figure 5 Statistical analysis of SNR voxels of original and averaged MR images. T1W scan (with TE = 11 ms, TR = 350 ms) of the original (A) and averaged (B) MR images, respectively, with blue and red circles indicating region of interest used to calculate SNR histograms for the lowest FH [Fe], 0.7 mM; (C) SNR voxel histograms of original and averaged images; (D) SNR values as a function of number of images used in averaging. The dashed line indicates the expected SNR increase with .
Abbreviation: SNR, signal-to-noise ratio.
![Figure 5 Statistical analysis of SNR voxels of original and averaged MR images. T1W scan (with TE = 11 ms, TR = 350 ms) of the original (A) and averaged (B) MR images, respectively, with blue and red circles indicating region of interest used to calculate SNR histograms for the lowest FH [Fe], 0.7 mM; (C) SNR voxel histograms of original and averaged images; (D) SNR values as a function of number of images used in averaging. The dashed line indicates the expected SNR increase with .Abbreviation: SNR, signal-to-noise ratio.](/cms/asset/53d1c139-88c9-4e55-a336-bd7bec1c87b0/dijn_a_12194528_f0005_c.jpg)
Figure 6 Statistical analysis of SNR voxels of original and averaged MR images. T2W scan (with TE= 90 ms, TR = 3000 ms) of the original (A) and averaged (B) MR images, respectively, with blue and red circles indicating region of interest used to calculate SNR histograms for the lowest FH [Fe], 0.7 mM; (C) SNR voxel histograms of original and averaged images; (D) SNR values as a function of number of images used in averaging. The dashed line indicates the expected SNR increase with .
Abbreviation: SNR, signal-to-noise ratio.
![Figure 6 Statistical analysis of SNR voxels of original and averaged MR images. T2W scan (with TE= 90 ms, TR = 3000 ms) of the original (A) and averaged (B) MR images, respectively, with blue and red circles indicating region of interest used to calculate SNR histograms for the lowest FH [Fe], 0.7 mM; (C) SNR voxel histograms of original and averaged images; (D) SNR values as a function of number of images used in averaging. The dashed line indicates the expected SNR increase with .Abbreviation: SNR, signal-to-noise ratio.](/cms/asset/06fe62be-a225-48f8-a346-f9aab8e264f5/dijn_a_12194528_f0006_c.jpg)
Figure 7 Measured relative contrast to water (RCW) for T1W (with TE= 11 ms, TR = 350 ms) and T2W (with TE= 90 ms, TR = 3000 ms) MR images acquired with different Fe FH concentrations. Dashed lines represent RCW values predicted by equation (3).
Abbreviations: ST2,Fe and ST1,Fe,T2W and T1W MR signals of Fe FH samples, respectively; ST2,w; ST1,w, T2W and T1W MR signals of water, respectively.
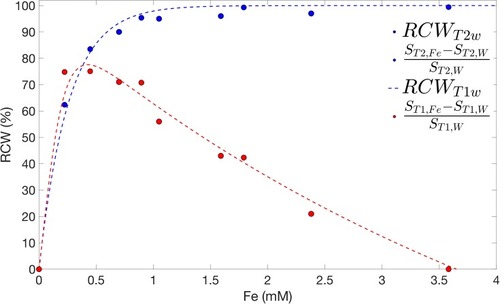
Table 2 Mean Intensity, Standard Deviation and Corresponding SNR Values for the Averaged T1W MR Images (at TE=11 Ms, TR = 350 Ms, N= 20) and PET Phantom Images at Different FH Fe Concentrations and Initial 89Z Activities
Figure 8 Spatial resolution assessment for MR, PET and co-registered PET-MR images. T1W image (with TE= 11 ms, TR = 350 ms) of the original (A) and averaged (B; N = 20) MR images ([Fe] = 0.70, 1.05 and 1.59 mM), respectively; (C) Reconstructed PET image (A0 = 0.98, 1.48 and 2.22 MBq); (D) Co-registered PET-MR (computed by averaging signals from PET and MR); dashed red, blue and green lines indicate where line profiles were calculated and used to measure FWHM at the edge of phantom images containing the lowest FH [Fe] (i.e. 0.7 mM) and 89Zr activity concentration (0.98 MBq); zoom-in of PET (E) and PET-MR (F) phantom images; (G) measured line spread function (LSF) of the MR, PET and PET-MR images.
Abbreviations: FWHM, full width at half maximum; LSF, line spread function.
![Figure 8 Spatial resolution assessment for MR, PET and co-registered PET-MR images. T1W image (with TE= 11 ms, TR = 350 ms) of the original (A) and averaged (B; N = 20) MR images ([Fe] = 0.70, 1.05 and 1.59 mM), respectively; (C) Reconstructed PET image (A0 = 0.98, 1.48 and 2.22 MBq); (D) Co-registered PET-MR (computed by averaging signals from PET and MR); dashed red, blue and green lines indicate where line profiles were calculated and used to measure FWHM at the edge of phantom images containing the lowest FH [Fe] (i.e. 0.7 mM) and 89Zr activity concentration (0.98 MBq); zoom-in of PET (E) and PET-MR (F) phantom images; (G) measured line spread function (LSF) of the MR, PET and PET-MR images.Abbreviations: FWHM, full width at half maximum; LSF, line spread function.](/cms/asset/f9b292e8-47f3-4706-a6e4-8760ecf07d85/dijn_a_12194528_f0008_c.jpg)