Figures & data
Figure 1 Schematic illustration of the preparation of HA-CHEMS-Cur-TPGS NPs, SPECT imaging and synergistic treatment.
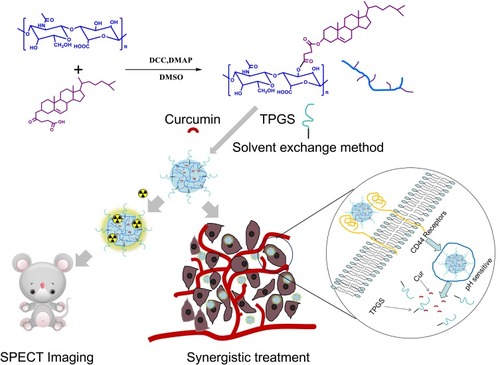
Figure 2 1H NMR spectrum (400 MHz, D2O/DMSO-d6) of HA-g-CHEMS.
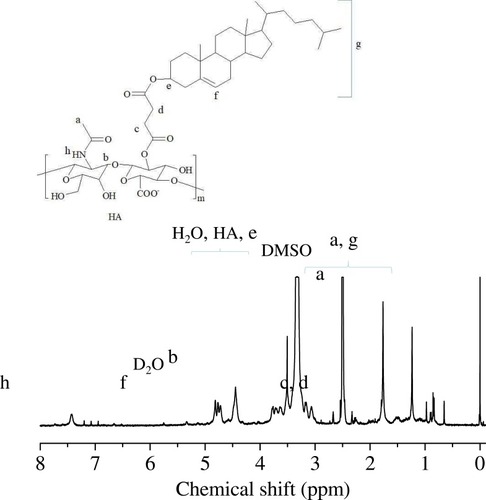
Figure 3 Characterization of nanoparticles: (A) Size and distribution as determined by DLS. (B) Morphology of HA-CHEMS-Cur-TPGS NPs as measured by TEM. (C) Colloidal stability at a concentration of 1 mg/mL in PBS. (D) Release of curcumin at a pH of 5.0, 6.5, and 7.4. (E) The correlation between the radiolabeling efficiency and added activity of 99mTc. (F) The radiostability of 99mTc-HA-CHEMS-Cur-TPGS NPs in the PBS and 10% FBS at 37 °C (n=3).
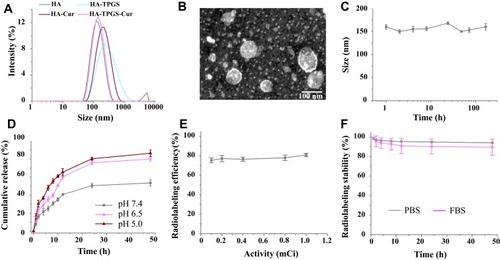
Figure 4 MTT assays. (A) Viability of 4T1 cell incubated with HA-CHEMS nanoparticles, with concentrations varying from 0 to 1 mg/mL. (B) Viability of 4T1 cell incubated with curcumin, HA-CHEMS-Cur NPs, HA-CHEMS-TPGS NPs and HA-CHEMS-Cur-TPGS NPs.
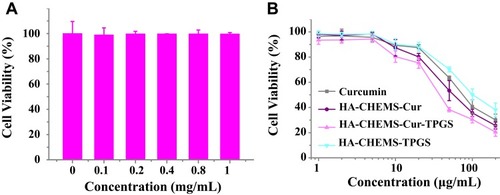
Figure 5 In vivo biodistribution of HA-CHEMS-Cur-TPGS NPs in 4T1-tumor-bearing BALB/c mice. MicroSPECT/CT of (A) 99mTc- HA-CHEMS-Cur-TPGS NPs and (B) injection of free HA 1 h earlier and followed by 99mTc-HA-CHEMS-Cur-TPGS NPs injection at 0, 2, 4, 6, 8 and 24 h post-injection in mice following the i.v. injection. (C) Percentage of tumor accumulation of 99mTc-HA-CHEMS-Cur-TPGS NPs after intravenous injection. (D) Blood circulation of 99mTc-HA-CHEMS-Cur-TPGS NPs at 24 h post-injection. (E) Biodistribution of major organs measured by γ-counter at 24 h post-injection.
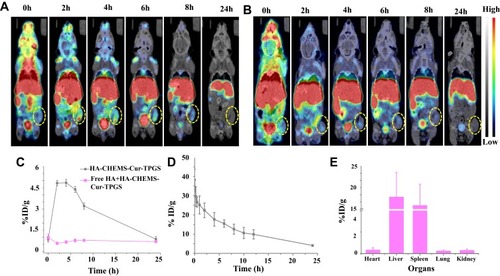
Figure 6 In vivo antitumor performance of nanoparticles in 4T1-tumor-bearing BALB/c mice. HA-CHEMS-Cur-TPGS NPs were given on days 0, 2, 4, 6 and 8 with a concentration of 50 mg/kg. (A) 4T1 tumor growth rate. Statistical analysis: *p<0.05, **p<0.01. (B) Survival curves of mice after 24 days. (C) Body weight changes of mice. (D) Photographs of tumor blocks collected from different treatments groups on day 14.
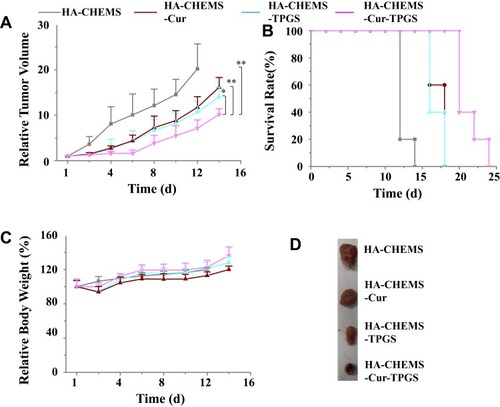
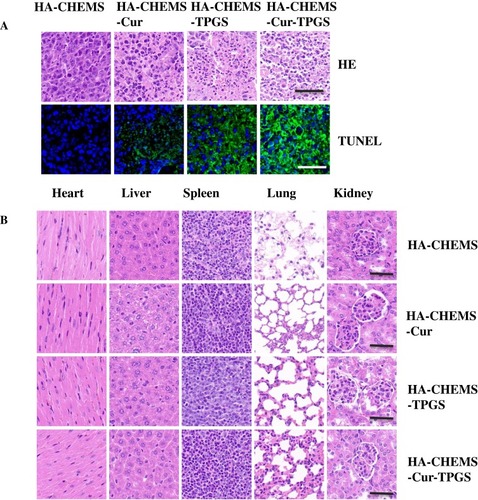
Figure 7 H&E and TUNEL staining assays of tumor (A) and health organs (B) in different treatment groups. All the scale bars present 100 µm.