Figures & data
Figure 1 (A) Schematic illustration of the theranostic functions of as-synthesized APS/AuNR/PLGA-PEG NPs, including their passive accumulation in tumor tissue via the typical EPR effect followed by PA imaging and FUS ablation of the tumor. (B) Schematic illustration of the synthetic procedure of APS/AuNRs/PLGA-PEG. (C) Coaction of immature DCs with APS. (D) Mature DCs identify antigen information and transmit it to T cells. (E) T cell activation, proliferation and differentiation to antigen-specific CTLs. (F) CTLs infiltrate into the tumor and kill the residual tumor.
Abbreviations: APS, astragalus polysaccharide; AuNRs, gold nanorods; PLGA, poly(lactic-co-glycolic) acid; PEG, polyethylene glycol; NPs, nanoparticles; PAI, photoacoustic imaging; FUS, focused ultrasound; CTLs, cytotoxic T lymphocytes; DCs, dendritic cells; mDCs, mature DCs; imDCs, immature DCs.
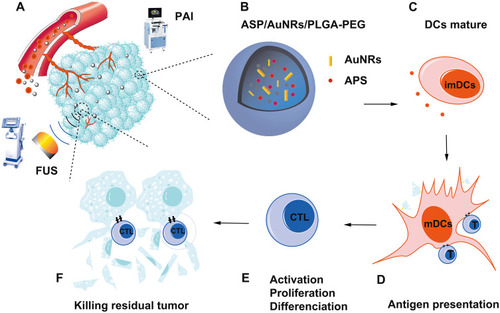
Figure 2 Synthesis and characterization of APS/AuNRs/PLGA-PEG. (A) Bright-field optical microscopy image (Magnification, 200 ×, scale bar, 20μm) and (B) TEM image (scale bar, 1μm) of APS/AuNRs/PLGA-PEG NPs. (C) The concentration-dependent absorbance of AuNRs at the wavelength 800 nm. (D) Size distribution changes of APS/AuNRs/PLGA-PEG over time. (E) Zeta distribution changes of APS/AuNRs/PLGA-PEG over time. (F) The concentration-dependent absorbance of APS at the wavelength 490 nm. (G) Size distribution with different volumes of APS. (H) Size distribution with different ultrasonic emulsification times for W/O. (I) Size distribution with different ultrasonic emulsification times for W/O/W.
Abbreviations: APS, astragalus polysaccharide; AuNRs, gold nanorods; PLGA, poly(lactic-co-glycolic) acid; PEG, polyethylene glycol; NPs, nanoparticles; TEM, transmission electron microscopy; W/O, water/oil; W/O/W, water/oil/water.
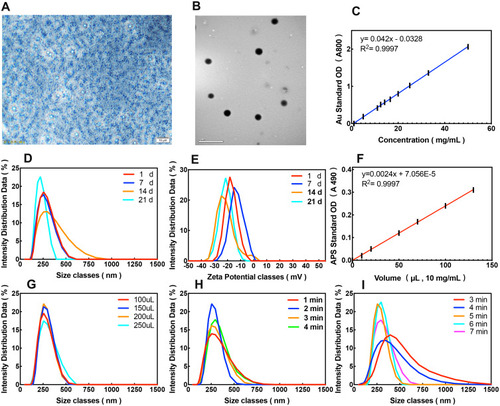
Table 1 Encapsulation Efficiency of APS
Figure 3 In vitro cytotoxicity and in vivo biosafety assay of APS/AuNRs/PLGA-PEG. (A) CCK8 for cell cytotoxicity of PBS (a), APS/AuNRs/PLGA-PEG (b), APS (c), AuNRs (d) and PLGA-PEG-COOH (e) after co-incubation with HUVEC for 24 h. (B) Cell cytotoxicity at different concentrations of APS/AuNRs/PLGA-PEG. (C) Hematological assay of BALB/c mice and (D) H&E staining of major organs from the control group and the experimental groups 1, 3, 7, and 14 days post intravenous injection of APS/AuNRs/PLGA-PEG. Magnification, 200 ×, scale bar, 50 μm.
Abbreviations: APS, astragalus polysaccharide; AuNRs, gold nanorods; PLGA, poly(lactic-co-glycolic) acid; PEG, polyethylene glycol; HUVECs, human umbilical vein endothelial Cells; ALT, alanine aminotransferase; AST, amino-transferase; BUN, blood urea nitrogen; CK, creatine kinase; CREA, creatinine; LDH, lactate dehydrogenase; CCK-8, Cell Counting Kit-8; H&E, hematoxylin-eosin.
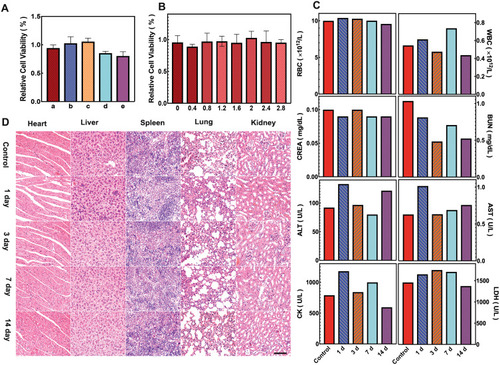
Figure 4 In vitro and in vivo PAI assessment of APS/AuNRs/PLGA-PEG. (A) PAI after local injection of 5 mg/mL APS/PLGA as the control group, different concentrations (1, 2, 3, 4, 5 mg/mL) of APS/AuNRs/PLGA, and (C) corresponding quantitative analysis of enhanced PA signal intensities. (B) PAI at a concentration of 5 mg/mL APS/PLGA and at concentrations of 1, 2, 3, 4, 5 mg/mL of APS/AuNRs/PLGA (from top to bottom) and (E) corresponding quantitative analysis of enhanced PA signal intensities. (D) PA spectrum of (3 mg/mL) from 680 nm to 970 nm.
Abbreviations: APS, astragalus polysaccharide; AuNRs, gold nanorods; PLGA, poly(lactic-co-glycolic) acid; PEG, polyethylene glycol; PAI, photoacoustic imaging.
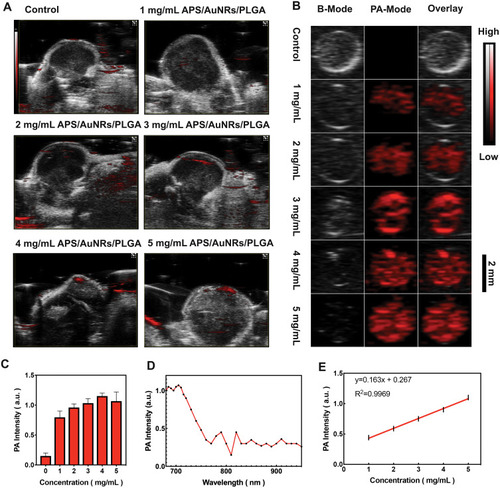
Figure 5 In vitro FUS ablation. (Aa-f) different concentration of APS/AuNRs/PLGA-PEG + FUS groups: (0 mg/mL, 1 mg/mL, 2 mg/mL, 3 mg/mL, 4 mg/mL, 5 mg/mL). (A) Flow cytometry for apoptosis rate, and (C) corresponding apoptosis rate analysis, Apoptosis rate =UR+ LR. (B) Trypan blue staining, showing the proportion of membrane-damaged cells (labeled with black arrow). Original magnification, 200 ×. All bars, 100 μm. (D) Corresponding living cell rate analysis. All statistical analysis was in comparison to the control group, *P< 0.05, **P< 0.01, ***P< 0.001.
Abbreviations: APS, astragalus polysaccharide; AuNRs, gold nanorods; PLGA, poly(lactic-co-glycolic) acid; PEG, polyethylene glycol; FUS, focused ultrasound.
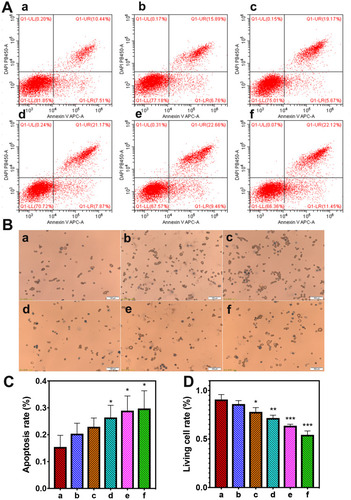
Figure 6 In vivo FUS ablation. (a-f) Different concentrations of APS/AuNRs/PLGA-PEG + FUS groups: (0 mg/mL, 1 mg/mL, 2 mg/mL, 3 mg/mL, 4 mg/mL, 5 mg/mL), 3 rabbits per group. (A) Rabbit liver after ablation. (B) Necrosis area analysis. (Insert: Maximum longitudinal section of necrotic tissue.) (C) Corresponding energy efficiency factor (EEF). All statistical analyses were in comparison to the control group. **P< 0.01, ***P< 0.001, ****P< 0.0001.
Abbreviations: APS, astragalus polysaccharide; AuNRs, gold nanorods; PLGA, poly(lactic-co-glycolic) acid; PEG, polyethylene glycol; FUS, focused ultrasound.
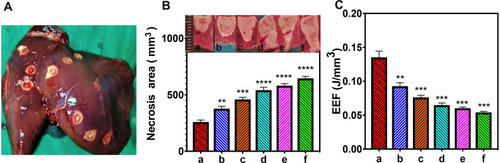
Figure 7 In vitro Flow cytometry and ELISA of the immune response. (Aa) Control group; (Ab) APS/AuNRs/PLGA-PEG NPs group; (Ac) APS group; (Ad) AuNRs group; (Ae) PLGA-PEG NPs group; (Af) LPS group. (A) Flow cytometry and corresponding analyses of the expression of MHC class II (C), CD86 (D) and CD80 (E) molecules on DCs. (B) Flow cytometry of the phagocytosis function of FITC-dextran of DCs and (F) corresponding analysis. (G) ELISA of IL-12 and (H) IFN-γ production of DCs. All statistical analyses were in comparison with the control group, *P< 0.05, **P< 0.01, ***P< 0.001, ****P< 0.0001.
Abbreviations: APS, astragalus polysaccharide; AuNRs, gold nanorods; PLGA, poly(lactic-co-glycolic) acid; PEG, polyethylene glycol; NPs, nanoparticles; IL, interleukin; DCs, dendritic cells; MHC-II, major histocompatibility complex; IFN, interferon; ALT, alanine aminotransferase; AST, amino-transferase; BUN, blood urea nitrogen; CK, creatine kinase; CR, creatinine; LDH, lactate dehydrogenase; FITC, fluorescein isothiocyanate; APC, allophycocyanin; PE, phycoerythrin; ELISA, enzyme-linked immunosorbent assay.
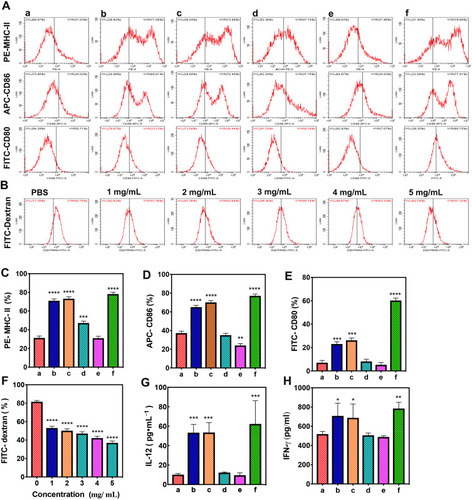
Figure 8 In vivo ELISA dynamic changes of TNF-α (A), IFN-γ (B), IL-4 (C), IL-10 (D), IgG1 (E) and IgG2a (F) concentration. (A) Control group; (B) PBS+ FUS group; (C) APS/AuNR/PLGA-PEG NPs+ FUS group; (D) APS + FUS group; (E) AuNRs + FUS group, (F) PLGA-PEG NPs + FUS group, fifteen mice per group and five mice were sacrificed each time. The APS/AuNR/PLGA-PEG NPs+ FUS and APS + FUS could significantly increase the concentrations of TNF-α, IFN-γ, IL-4, IL-10 and IgG1, P<0.001. The concentrations of IgG2a had no significant difference, P> 0.05.
Abbreviations: APS, astragalus polysaccharide; AuNRs, gold nanorods; PLGA, poly(lactic-co-glycolic) acid; PEG, polyethylene glycol; NPs, nanoparticles; FUS, focused ultrasound; IL, interleukin; TNF, tumor necrosis factor; IFN, interferon; IgG, immunoglobulin G.
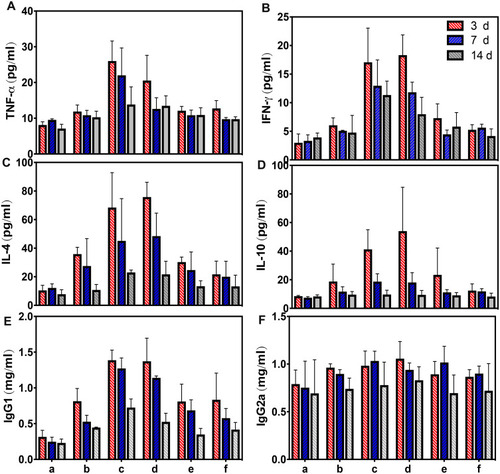
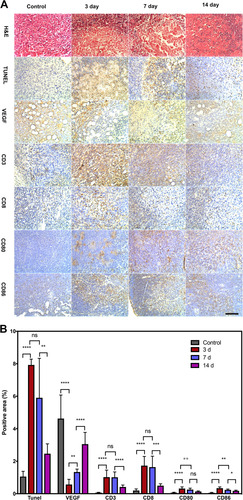
Figure 9 Immunohistochemical staining of the APS/AuNR/PLGA-PEG NPs+ FUS group on day 0, 3, 7, and 14. (A) H&E staining (first row), TUNEL staining (second row), VEGF staining (third row). Immunohistochemical staining of positive expression (brown) of tumor-infiltrating CD3+ (fourth row), CD8+ (fifth row), and lymphoid-infiltrating CD80+ (sixth row), CD86+ (the last row) in the control group: 0 day (left column) and APS/AuNR/PLGA-PEG NPs+ FUS group at 3 days (second column), 7 days (third column) and 14 days (right column). Original magnification, 200×. Bar, 50 μm. (B) Corresponding statistical analysis columns, mean; error bar. *P < 0.05; **P< 0.01; *** P < 0.001; ****P<0.0001. Data were pooled from two independent experiments with five mice per group.
Abbreviations: APS, astragalus polysaccharide; AuNRs, gold nanorods; PLGA, poly(lactic-co-glycolic) acid; PEG, polyethylene glycol; NPs, nanoparticles; FUS, focused ultrasound; TUNEL: TdT-mediated dUTP nick-end labeling; H&E, hematoxylin-eosin; VEGF, vascular endothelial growth factor; CD, cluster of differentiation.