Figures & data
Figure 1 Chemical structures of 2DA-Glu (A), 2DA-Glu-FITC (B), PTX-SUC (C) and 2DA-FITC-PTX (D).
Abbreviations: 2DA, 2-glucosamine, red; FITC, fluorescein-5(6)-isothiocyanate, green; PTX, paclitaxel, crimson; Glu, glutamic acid, linker, blue; Arg, arginine, linker, light blue; SUC, succinic anhydride, linker, black.
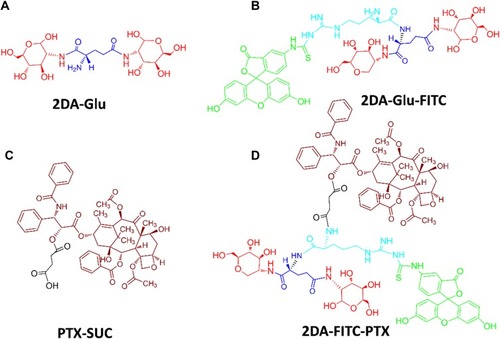
Figure 2 Formulation and characterization of prodrug-based nanoparticles. (A) Schematic illustration of the procedure for self-assembly of 2DA-FITC-PTX NPs. (B) TEM images of 2DA-FITC-PTX NPs. (C) DLS of 2DA-FITC-PTX NPs. (D) In vitro release of PTX in different buffer. PTX concentration was measured by HPLC. The release was expressed as mean ± standard deviation based on triplicate experiments.
Abbreviations: 2DA-FITC-PTX NPs, 2-glucosamine-fluorescein-5(6)-isothiocyanate-glutamic acid-paclitaxel nanoparticles; TEM, transmission electron microscopy; DLS, dynamic light scattering; PTX, paclitaxel; HPLC, high-performance liquid chromatography.
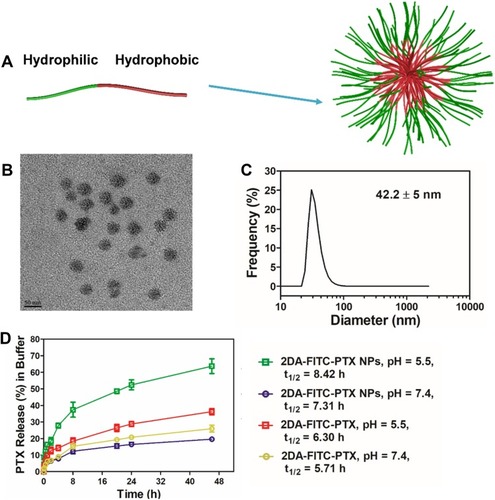
Figure 3 Evaluation of cell uptake of FITC-labeled 2DA-PTX or 2DA-PTX NPs after incubation with MDA-MB-231 cells for 1, 4, and 8 h via confocal microscopy and flow cytometry analysis. The confocal microscopy images of MDA-MB-231 cell uptake from 2DA-FITC-PTX NPs (A) and 2DA-FITC-PTX (B) following various incubation times. Both the 2DA-FITC-PTX NPs and 2DA-FITC-PTX were labeled with FITC (green). The blue fluorescence was from the cell nucleus (DAPI, blue). Scale bars are 21 μm. The flow cytometric analyses of cell uptake from 2DA-FITC-PTX NPs (C) and 2DA-FITC-PTX (D).
Abbreviations: 2DA-FITC-PTX NPs, 2-glucosamine-fluorescein-5(6)-isothiocyanate-glutamic acid-paclitaxel nanoparticles; 2DA-FITC-PTX, 2-glucosamine-fluorescein-5(6)-isothiocyanate-glutamic acid-paclitaxel; FITC, fluorescein isothiocyanate; DAPI, 4,6-diamino-2-phenyl indole.
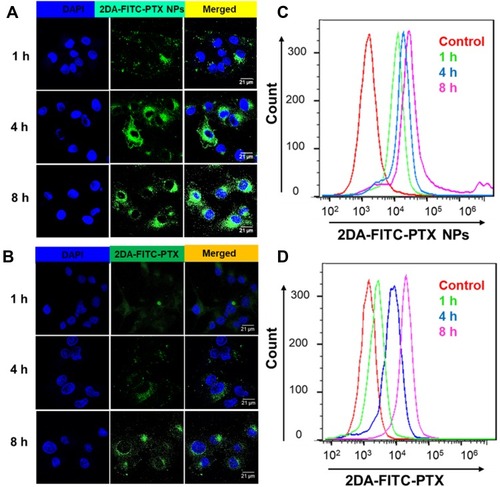
Figure 4 Cell viability and apoptosis analysis after treatment with 2DA-FITC-PTX and 2DA-FITC-PTX NPs. Cell viability of 293T cells (A) and MDA-MB-321 cells (B) following incubation with free PTX drug, 2DA-FITC-PTX, and 2DA-FITC-PTX NPs for 48 h. The IC50 of free PTX drug, 2DA-FITC-PTX, and 2DA-FITC-PTX NPs for 293T cells and MDA-MB-231 (C). The cell apoptosis of MDA-MB-231 cells following incubation with free PTX drug, 2DA-FITC-PTX, and 2DA-FITC-PTX NPs for 24 and 48 h (D), and the apoptosis cycle percentage in Q2 and Q4 zones (E).
Abbreviations: PTX, paclitaxel; 2DA-FITC-PTX, 2-glucosamine-fluorescein-5(6)-isothiocyanate-glutamic acid-paclitaxel; 2DA-FITC-PTX NPs, 2-glucosamine-fluorescein-5(6)-isothiocyanate-glutamic acid-paclitaxel nanoparticles, and the PE Annexin V/Dead Cell Apoptosis Kit with SYTOX® green dye for flow cytometry.
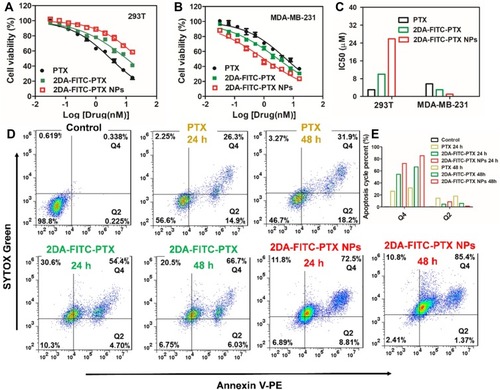
Figure 5 Acute toxicity and in vivo NIR and optical imaging analysis. (A) Blood biochemistry test of AST (A) and ALT (B) after various treatments (n = 4). (C) In vivo NIR imaging in MDA-MB-231 xenograft tumor mice (n = 4). (D) Time courses of tumor-to-normal tissue (T/N) ratio in MDA-MB-231 tumor for 2DA-ICG-PTX and 2DA-ICG-PTX NPs. Statistical analysis indicates significant difference of T/N ratio in the MDA-MB-231tumors between the two drugs (n = 4). (E) Ex vivo fluorescence images of tumor tissues after 48, 72 h post-injection of FITC-labelled 2DA-FITC-PTX and 2DA-FITC-PTX NPs intravenously (n = 4). *P < 0.05; **P < 0.01. Scale bars are 100 μm.
Abbreviations: AST, aminotransferase; ALT, alanine aminotransferase; NIR, near-infrared; 2DA-ICG-PTX, 2-glucosamine-fluorescein-5(6)-isothiocyanate-glutamic acid-paclitaxel, 2DA-ICG-PTX NPs, 2-glucosamine-fluorescein-5(6)-isothiocyanate-glutamic acid-paclitaxel nanoparticles.
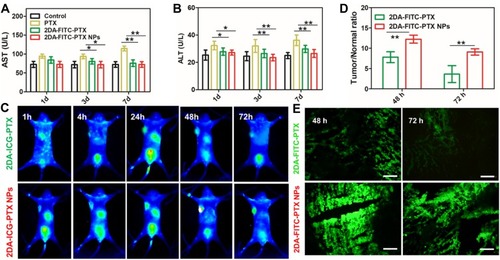
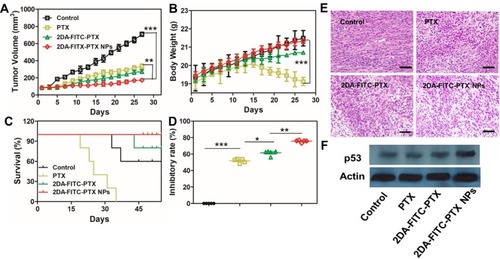
Figure 6 In vivo antitumor evaluation. (A) MDA-MB-231 tumor growth curves, (B) body weight with various treatments, (C) survival curve, and (D) tumor growth inhibition rates (n = 5). *P < 0.05 and **P < 0.01. (E) Tumor tissue images under various treatments. Scale bars are 100 μm. (F) Tumor tissue Western blotting results of p53 expression under various treatments: *P < 0.05, **P < 0.01, and ***P < 0.001.
Abbreviations: PTX, paclitaxel; 2DA-ICG-PTX, 2-glucosamine-fluorescein-5(6)-isothiocyanate-glutamic acid-paclitaxel; 2DA-ICG-PTX NPs, 2-glucosamine-fluorescein-5(6)-isothiocyanate-glutamic acid-paclitaxel nanoparticles.