
Figures & data
Figure 1 (A) CAD image used in the design of the “magnetically induced rotation and translation (MIRT)” trays. The lanes have rounded bottoms to simulate tubular conduits within the body. (B) Photograph of the MIRT tray mounted on a plexiglass plate, over the mini-Med magnet, in the offset above position (at a height of 20 cm). (C) Photograph of a portion of the tray, showing three lanes (or channels) loaded with MNPs at their starting points, before the initiation of the rotation and translational movement induced by activating the mini-MED. Use of the tray lanes can be used to facilitate side-by-side comparisons of different types of MNPs, MNP modifications, the addition of drugs, or alterations of the media and cells within the channels. The tray is compatible with a standard 96-well plate reader.
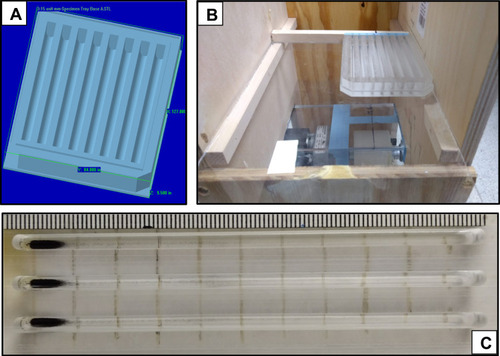
Figure 2 Schematic illustrating the standardized MIRT tray positions used in this paper. This perspective is rotated 90 degrees to the left, from that shown in . The figure is not drawn to scale: in actuality, the tray in the pull position would be relatively closer to the rotating magnet, if the starting positions for the MNPs were all 20 cm from the center of the magnet.
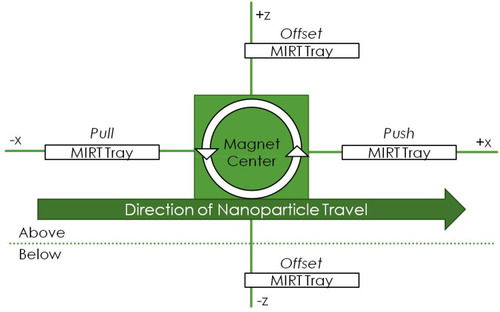
Figure 3 (A) Comparison of the magnetic separation times of the four different MNPs (n=3). (B) Average MIRT tray velocity (pull position) plotted as a function of the inverse of magnetic separation (clearance) time. The MBs separate most quickly and move the fastest in the MIRT tray. (C) MNP velocities plotted centimeter by centimeter as they move down the tray, in the pull position, showing the differences according to particle type (n≥3). (D) MNP acceleration, in the pull position, showing the greater acceleration as particles approach the magnet as demonstrated by the MBs.
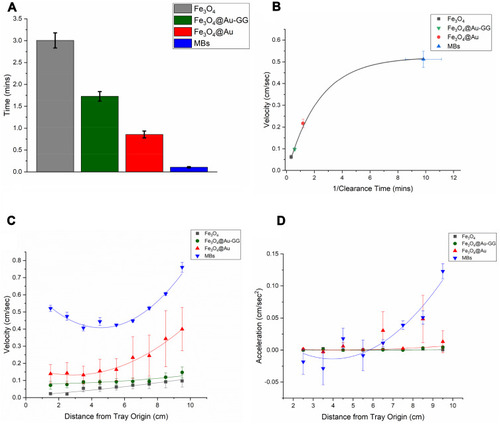
Figure 4 (A) CT images of 0–500 µL of agarose-embedded MBs in tissue culture wells. (B) Ultrafast gradient-echo MR images of agarose-embedded MBs, with concentrations as indicated. Here, use of adjacent wells was avoided, in order to avoid imaging artifacts. (C) Average MB velocity according to tray position (n>3). MBs moved fastest in the pull position. (D) MB velocity according to tray position, centimeter by centimeter, as determined by video analysis. In the pull position, they accelerate as they approach the magnet; in the push position, velocity falls off. (E) MB acceleration according to tray position, which similarly shows the greatest acceleration close to the magnet, and acceleration decreasing in the push position farther away from the magnet. (F) Velocities of MBs in the offset above position, with the tray at three different heights above the mini-MED (n=9). As expected, increasing the distance from the rotating magnet resulted in decreased velocities of the particles.
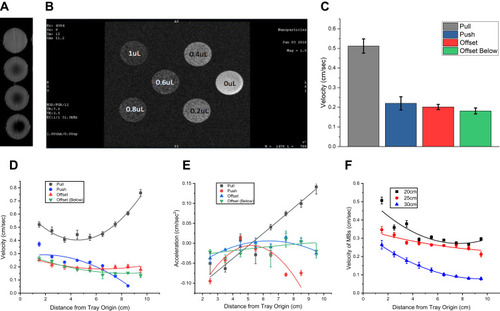
Table 1 Effect of Lane Position (Pull vs Offset Above) and Aliquot Size (20 vs 100 µL) on Average Velocity of MB Clusters
Figure 5 (A and B) A comparison of dye diffusion versus magnetically enhanced dye delivery, as demonstrated in the MIRT tray. (A) Positions of MBs with dye (top three lanes) and dye samples alone (bottom three lanes) at the time of mini-MED activation, with blue dye targets in the central portion of the tray. (B) Positions 30 sec later, when the MBs bring the yellow dye into contact with the blue target region (top three lanes), versus dye diffusion proceeding without MBs (bottom three lanes). (C) Bar graph showing a comparison of the velocities of MB-induced dye delivery versus movement by diffusion alone (n=3). (D) Photograph showing dye movement in response to MBs in a branched tray system, after 15 mins of mini-MED activation. MBs drag blue and yellow dyes (as drug surrogates) along with them, which then co-mingle to form green. (E and F) Effect of trypan blue dye on MB dispersion. (E) Photomicrograph of MBs in PBS. (F) Photomicrograph of MBs in PBS with addition of trypan blue, showing the resulting increase in particle dispersion (10× magnification).
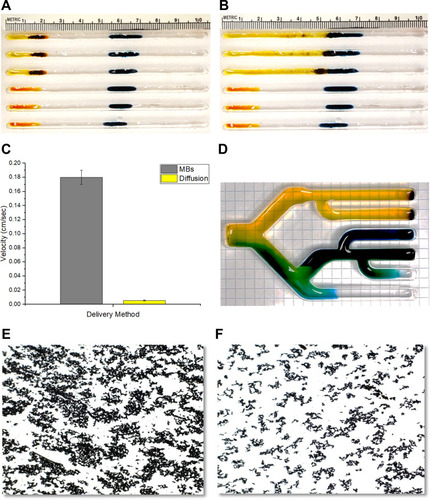
Figure 6 (A) Photograph showing the pattern of MBs as they fan out across a cellular monolayer. (B) Photomicrograph showing the adherence of MBs to live cancer cells, as seen by phase-contrast microscopy. The MB clusters are seen here as highly refractile (white) particles. (C) Photomicrograph showing the adherence of MBs to fixed cancer cells (E297, human glioblastoma), after H&E staining. (D) A scanning electron microscope (SEM) image of an MNP cluster on a glioblastoma cell (arrow). (E) Bar graph indicating the relative adherence of MBs to different types of cells, unfixed (blue) versus fixed with paraformaldehyde (gray), as quantified using ImageJ (LKB1, E297 and U87 are glioma cells; Astrocytes are not neoplastic).
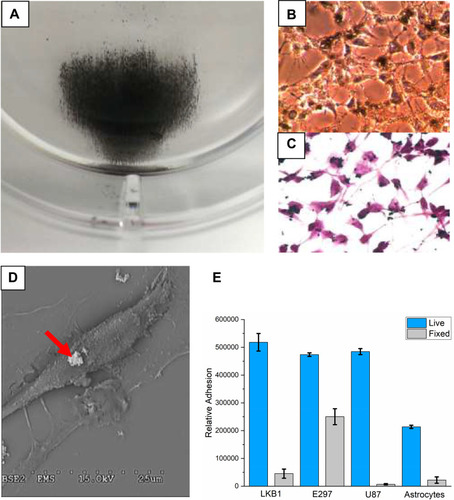
Figure 7 (A) Photomicrograph of residual (adherent) MBs in a MIRT lane containing U138 (human glioblastoma) cells. Cell nuclei were stained with Hoechst 33342. MBs clusters appear white on this image. Cells are blurry at the top of the photo, due to the curvature of the tray lane. (B) Graph showing the effect of cell type on MB velocity in the MIRT tray, in the offset above position. Different cell types were found to have different effects on the velocity and dispersion of the MB clusters.
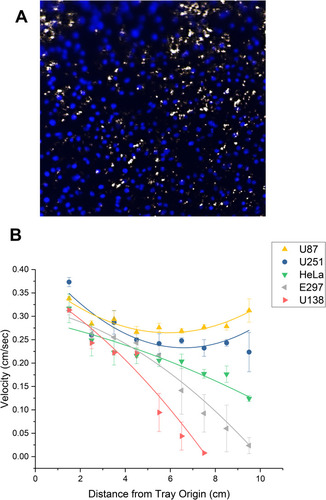
Figure 8 Etoposide cytotoxicity in static vs dynamic (MIRT tray) studies. (A) Viability analysis of etoposide treatment of U138 cells in a 12-well plate, as determined by MTT assay. 1 µM, 10 µM, and 100 µM etoposide were used and compared to 10 µL of DMSO (10 µM volume equivalent) alone per well (n=3). (B and C) Trypan blue cell viability analyses after MBs were used to move etoposide down the lanes of the MIRT tray. (B) U138 (human glioblastoma) cells. (C) H2122 (human lung adenocarcinoma) cells. MBs successfully transported etoposide by convection/bulk flow (5 mins) to allow cancer cell killing as shown by this assay (n = 3; *p < 0.05).
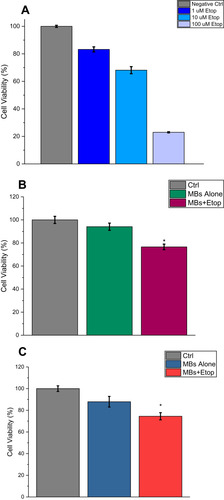
Table 2 Variables Influencing Rotational Magnetic Drug Targeting (rMDT) in vitro (Factors May Be Redundant, Overlap, Interact)
Table 3 Applications for Remote MNP-Enhanced Drug Delivery for Representative Conduits and Surfaces in the Human Body