Figures & data
Figure 1 Scanning electron microscope (SEM) analysis. (A) SEM images of PCL-Control and PCL-SPC at 5 and 20 kx magnifications. (B) Comparative study of fiber diameter of synthesized electrospun mats. Data are presented as mean±SD.
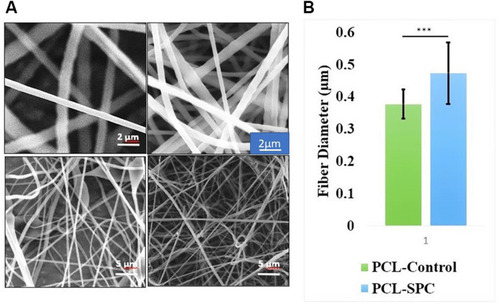
Figure 2 FTIR and EDS analyses of nanofibrous wound dressings. (A) FTIR analysis of PCL-SPC and PCL-Control samples. The vibrations at 1,724 cm−1 and 1,471–1,418 cm−1 represent C=O and –CH2 stretches, respectively, arrows indicate various functional groups. (B) EDS analysis of PCL-SPC and PCL Control samples. PCL-Control spectrum showed peaks characteristic for the existence of carbon and oxygen elements only, confirming purity of the samples. The presence of sodium was confirmed by enhanced intensity of carbon and oxygen representative peaks.
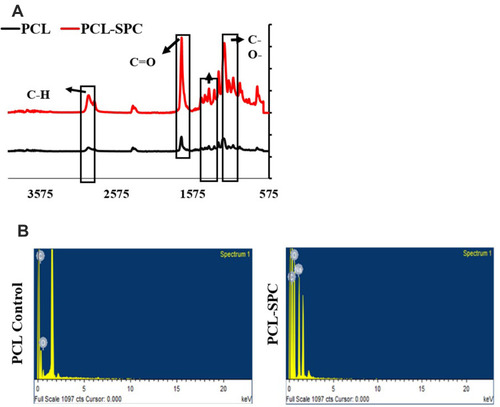
Figure 3 Oxygen release profile of electrospun mats over a time duration of 10 days in both PCL-Control and PCL-SPC groups. Data is presented as mean±SD. A relatively uniform enhancement of oxygen level was determined in the solution with pH between 7.3 and 7.6 in PCL-SPC blend nanofibers compared to PCL only fibers (control group).
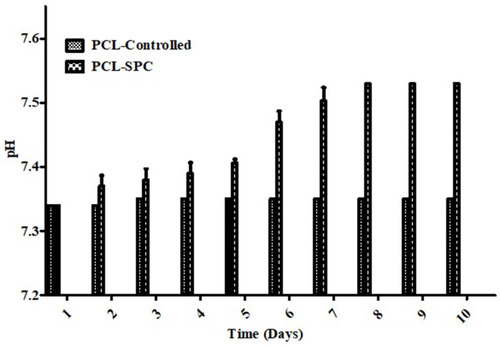
Figure 4 Molecular analysis of Hypoxia-inducible factor-1 (HIF-1α). (A) Relative mRNA expression analysis of HIF-1α gene in PCL-SPC; PCL Control and Control groups by q-PCR. (B-C) Protein expression analysis of HIF-1α protein in PCL-SPC; PCL Control and Control groups by Western blotting. Data are expressed as mean±SD. *P≤0.05; ***P≤0.001.
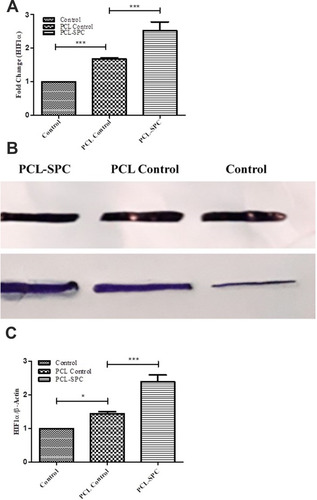
Figure 5 Chorioallantoic membrane (CAM) assay. (A) Electrospun mats implanted in the fertilized eggs. Closer images of the mats showed the presence of blood vessels around them. CAM assay retrieved samples are shown; arrows indicate the dried blood vessels. (B) Blood vessels quantification using images of the scaffolds retrieved from CAM assay by blind scoring. Data are presented as mean±SD. ***P≤0.0001.
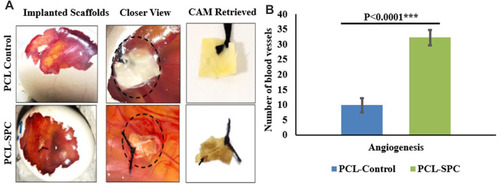
Figure 6 Representative macroscopic analysis of wounds. Sham, PCL-Control and PCL-SPC are shown at days 3, 7, 14, 21, and 27 post-wounding. Wound areas were calculated through image J software. No significant difference was observed in all experimental groups throughout the experimental study.
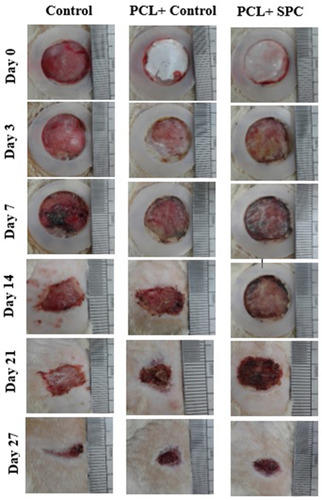
Figure 7 Percentage of wound size reduction. Graphical data are presented as mean±SD (n=3) at days 3, 7, 14, 21, and 27. ns, non-significant; *P≤0.05. No significant difference was reported in all experimental groups throughout the experimental study.
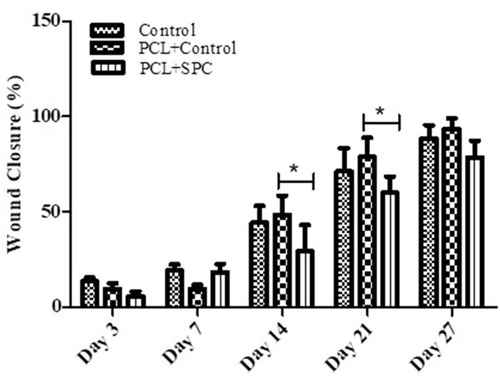
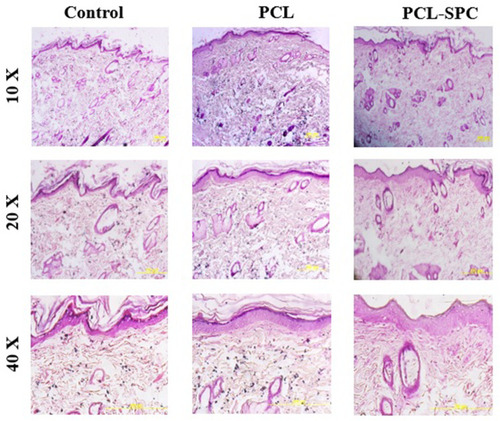
Figure 8 Representative images of H&E stained healed skin sections harvested 27 days post-wounding. It can be observed that PCL-SPC treatment was promising in improving the architecture of the epidermis and dermis compared to both sham and PCL control groups.