Figures & data
Figure 1 Results of the characterization test for the nanocomposite (A) Raman spectroscopy of rGO-Fe3O4, (B) TEM micrographs before and (C) after reduction of graphene oxide and simultaneous attaching of Fe3O4 nanoparticles. Red arrows point Fe3O4. (D) Visual response of the nanocomposite dissolved in water and exposed to an external permanent magnetic field. (E) Magnetic characterization by VSM at room temperature. The inset shows close view of hysteresis loop.
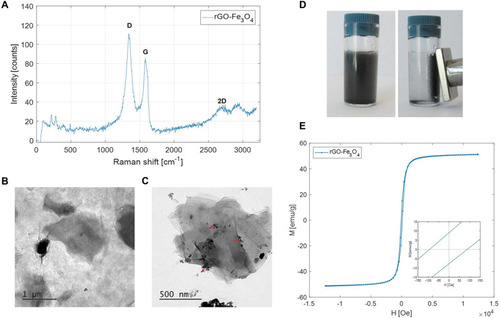
Table 1 Parameters of the Hysteresis Loop for rGO-Fe3O4 and Similar Nanocomposites from Other Studies
Figure 2 Cytotoxicity evaluation. Relative cell viability evaluated by trypan blue, MTT and Calcein AM assays. Statistical analysis was conducted using two-way ANOVA and a Dunnet’s multi comparison test. * is used for p-value < 0.05, ** for p-value < 0.01, *** for p-value < 0.001 and **** for p-value < 0.0001. Error bars depict SD of data.
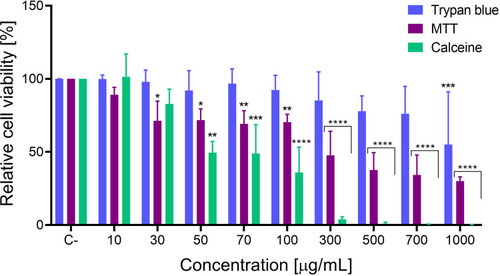
Figure 3 Interaction between cells and graphene nanocomposite. Fluorescent confocal micrographs of HeLa cells with the nanocomposite pointed with yellow arrows for dark aggregates and rounded in red for intense fluorescent deposits. The area enclosed in white squares is zoomed in the last row. Scale bar is 5 µm.
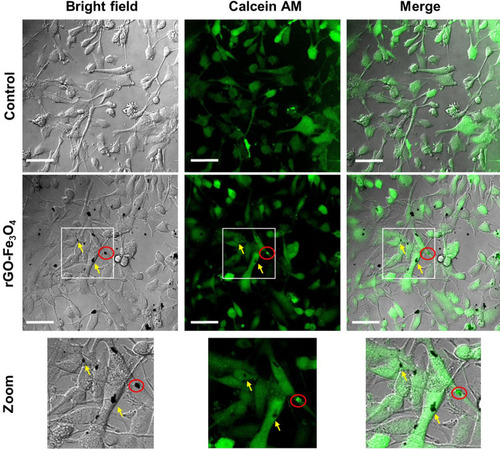
Table 2 Irradiation Condition, Maximum Temperature Difference, and Cell Viability After Photothermal Therapy with Different Graphene-Based Nanocomposites
Figure 4 Photothermal behavior of the nanocomposite. (A) Temperature profile of the rGO-Fe3O4 dissolved in water and increasing the surroundings temperature while it is irradiated with an 804 nm optical laser (1 W/cm2 for 5 minutes). Temperatures in all treatments were normalized to the same initial room temperature (21.1°C). (B) Thermal images of the nanocomposite (100 µg/mL) contained in a petri dish (35 mm) and under the same irradiation conditions. The temperature described is the highest temperature in the dish.
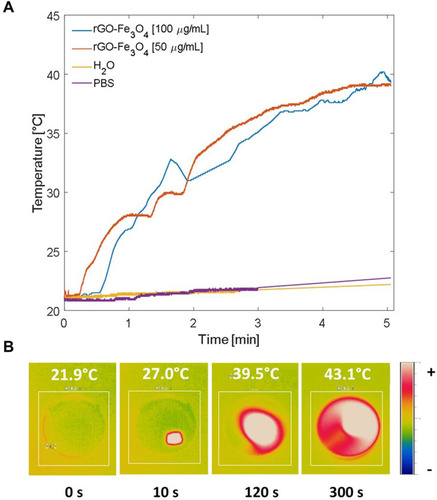
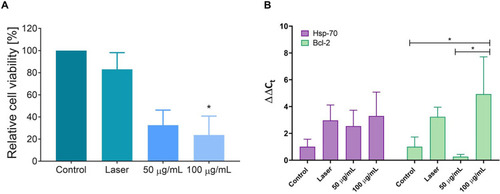
Figure 5 Effect of the photothermal therapy. (A) Efficacy of the therapy evaluated as the relative cell viability. Analysis was conducted using one-way ANOVA and a Dunnet’s multiple comparison test. (B) Relative expression of mRNA of Hsp70 and Bcl-2 genes using β-actin as housekeeping gen. Statistical analysis was conducted using two way ANOVA with Sidak’s multiple comparison test. * refers to a p-value < 0.05. Error bars depict SD of data.