Figures & data
Figure 1 Preparation of hyaluronidase-combined nanoparticles and mechanism of penetration into solid tumor.
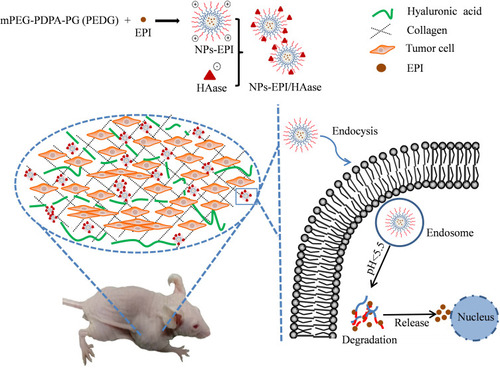
Figure 2 Size distribution by intensity (A), Zeta potential (B) and TEM images (C) of NPs-EPI; Size distribution by intensity (D), Zeta potential (E) and TEM images (F) of NPs-EPI/HAase; Hemolysis rate of carrier materials (G). Scale bars represent 200 nm.
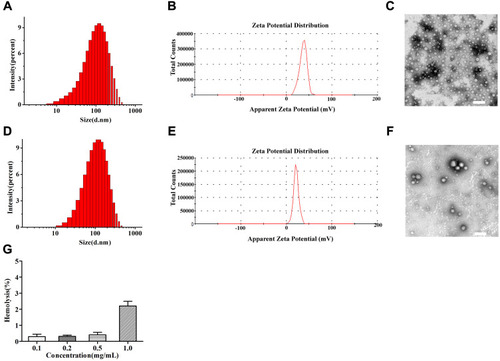
Figure 3 Representative TEM images of NPs-EPI in HepG2 spheroid sections. Arrows showed the drug-loaded micelles NPs-EPI. The micelles were discovered in the vesicles (A, B) and lysosomes (C). Flow cytometric profiles of cellular uptake of NPs-EPI (D). The average fluorescence intensity of EPI in different treatment groups (E). **P<0.01, ***P<0.001. Data represent the mean±SD (n=3). Scale bars for A, B, and C represent 500 nm, 200 nm, and 100 nm, respectively.
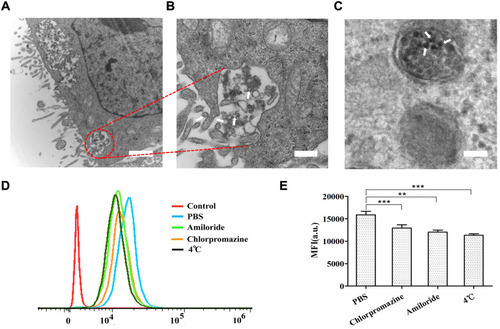
Figure 4 Confocal microscopy images of HepG2 tumor spheroids co-incubated with NPs-EPI, NPs-EPI/HAase (combined with 0.05, 0.1, 0.5, 1.0 mg/mL HAase, respectively) for 1 hour (A), 4 hours (B), and 8 hours (C). The penetration percentage of NPs-EPI and NPs-EPI/HAase (combined with 0.05, 0.1, 0.5, 1.0 mg/mL HAase, respectively) for 1 hour (D), 4 hours (E), and 8 hours (F) at 100 μm sections. Data represent the mean±SD (n=3). *P<0.05, **P<0.01, ***P<0.001. Scale bar represents 100 μm.
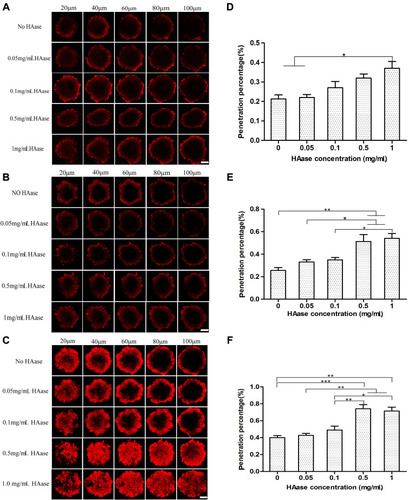
Figure 5 Fluorescence inverted microscopy images (A) and confocal microscopy images (B) of HepG2 tumor spheroids upon incubation with NPs-EPI, NPs-EPI/HAase (combined with 0.05, 0.1, 0.5, 1.0 mg/mL HAase, respectively). Scale bars for A, B represent 200 μm and 50 μm, respectively.
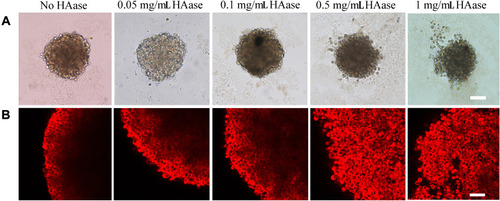
Figure 6 HA-stained cryosections of spheroids in the HAase-untreated group (A) and HAase-treated group (B). HAase-treated spheroids were exposed to NPs/HAase combined with 0.5 mg/mL of HAase for 8 hours before sectioning and staining. HA stain was showed in green and the nuclear stain, DAPI, was shown in blue. Scale bar represents 100 μm.
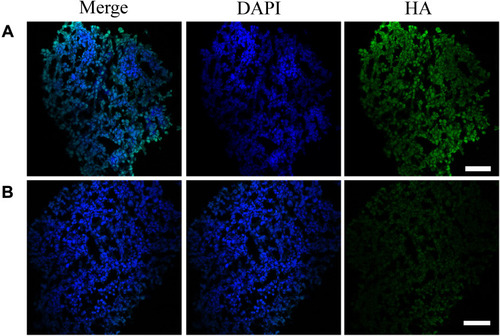
Figure 7 The changes of tumor volume and mice body weight during the construction of the tumor penetration model. (A) Photographs of tumors harvested from different groups on day 23. (B) Body weight changes in mice following different treatments within 23 days. (C) Tumor volume changes in time of mice treated with saline, EPI, NPs-EPI and NPs-EPI/HAase. The formulations were given on days 8, 11, 14, 17 and 20 at a dosage of EPI was 3 mg/kg while the concentration of HAase combined with micelles was 3 mg/mL. Black arrows represent the time of injection. Data represent the mean±SD (n=3). *P<0.05, **P<0.01, ***P<0.001.
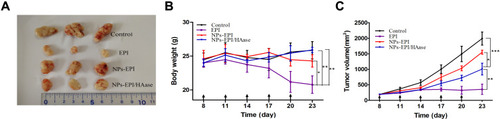
Figure 8 Tumor penetration behavior of NPs-DiD studied by confocal microscopy. The nuclei was stained with DAPI (blue), HA was stained with HABP (green), and NPs-DiD was presented in red. Scale bar represents 100 μm.
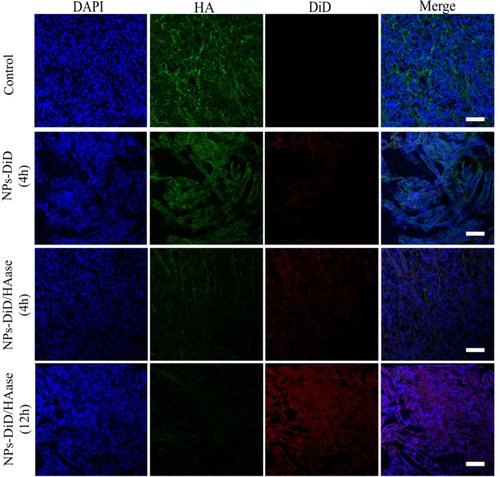
Figure 9 (A) Immunofluorescence imaging of tumor slices after treatment with saline, EPI, NPs-EPI and NPs-EPI/HAase. Saline-injected tumor slices were invoked as the control. The HA was stained with HABP, collagen I was stained with the anti-collagen I antibody, α-SMA was stained with the anti-α-SMA antibody, tumor blood vessels were stained with the anti-CD31 antibody, respectively. The nuclei of cells (blue) were stained with DAPI. Scale bar represents 100 μm. Quantitative analysis of HA (B), collagen I (C) and α-SMA (D) fluorescence intensity used Image J. The average fluorescence intensity of tumors from saline-treated mice was set as 1. (E) Statistic data of vascular pixel area (red) percentage of tumors slices used Image J. Values indicate mean ±SD (n=6 from 3 tumor samples per study group). *P<0.05, **P<0.01.
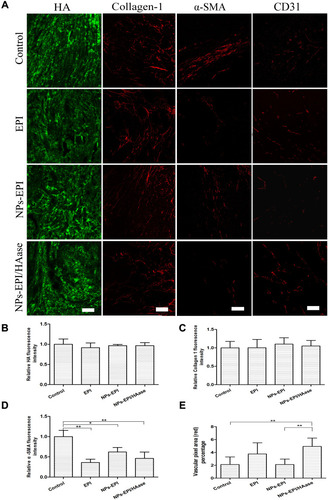
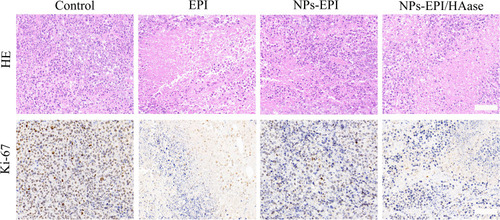
Figure 10 H&E and Ki-67 staining of the HepG2 tumor slices from mice treated with saline, EPI, NPs-EPI and NPs-EPI/HAase. Scale bar represents 100 μm.