Figures & data
Figure 1 Schematic diagram of the overall study.
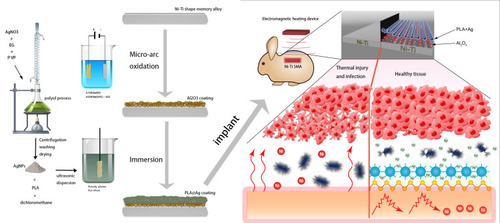
Figure 2 Morphology and characterization of APA multifunctional coating. (A–C) TEM diagrams of AgNPs with different particle sizes (10.77nm, 34.9nm, 96.7nm). (D) Ag nanoparticle size distribution analysis. (E) The crystallography of PLA@Ag film characterized by X-ray diffraction (XRD) analysis. (F) Fourier transform infrared spectra for PLA@Ag film with different nanosize. (G) SEM image of AgNPs dense distribution on the APA multi-function coating surface. (H) The cross-sectional SEM image of NiTi alloy rods after MAO processes. (I, J) The porous and rough surface of NiTi alloy rods after MAO processes. (K–M) The cross-section of APA multi-function coating without the Al2O3 layer. (N–P) The cross-section of APA multi-function coating with the Al2O3 layer.
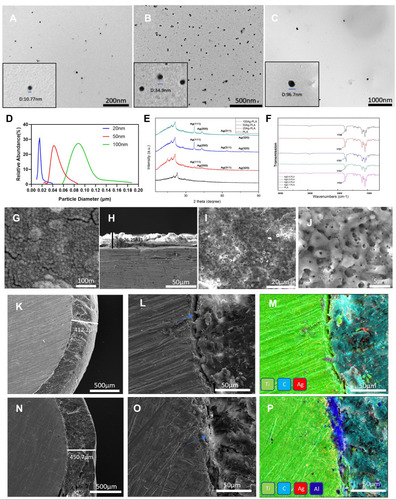
Figure 3 Antibacterial properties of APA multifunctional coating. (A–D) UV absorption spectrum at 620nm of bacterial liquid co-culture with different PLA@Ag film for 4h, 8h, 12h and 24h, respectively. (E, F) Growth of bacteria in different concentrations and nanosize of AgNPs on blood agar at 12h. (G, H) Total bacterial count for PLA@Ag film with different Ag nanosize and concentration. (I) Ag release experiment for PLA@Ag film with different Ag nanosize (20nm, 50nm, 100nm). (J) Ag release experiment for PLA@Ag film with different Ag concentration (0.1wt%, 0.2wt%, 0.3wt%, 0.4wt%). **p< 0.02, ***p< 0.001.
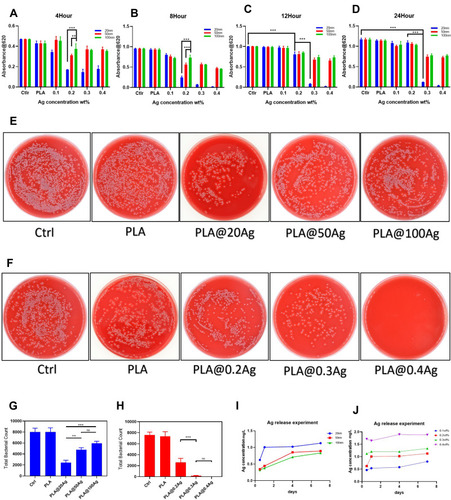
Figure 4 Antibacterial properties of APA multifunctional coating under different temperatures. (A) UV absorption spectrum at 620nm of bacterial liquid co-culture with different PLA@Ag film at different temperature (37°C, 41°C, 45°C, 49°C), respectively. (B) UV absorption spectrum at 620nm of bacterial liquid co-culture with different PLA@Ag film at 37°C (pretreated at 37°C, 41°C, 45°C, 49°C), respectively. (C) Ag release experiment for [email protected] film at different temperature (25°C, 37°C, 41°C, 45°C, 49°C). (D) Live & dead bacterial viability under a fluorescence microscope after co-culture with different PLA@Ag film at different temperature (37°C, 41°C, 45°C, 49°C). ***p< 0.001.
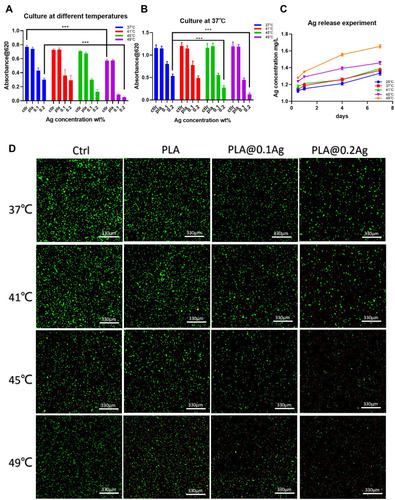
Figure 5 Thermal insulation test for APA multifunctional coating. (A, B) Thermal images of each sample (PLA, [email protected], [email protected], [email protected], PLA@20Ag, PLA@50Ag, PLA@100Ag). (C, D) Temperature curve for each sample (PLA, [email protected], [email protected], [email protected], PLA@20Ag, PLA@50Ag, PLA@100Ag, NiTi and NiTi-AL2O3). (E, F) Thermal conductivity of different PLA@Ag film. (G, H) Infrared reflectivity rates for different PLA@Ag film. (I) Thermal images of NiTi and NiTi-Al2O3. (J) Temperature curve for NiTi and NiTi-Al2O3. (K–M) Thermal imaging, temperature curve and surface temperature of Simulated heating in vitro for each sample (NiTi and NiTi-APA). ***p< 0.001.
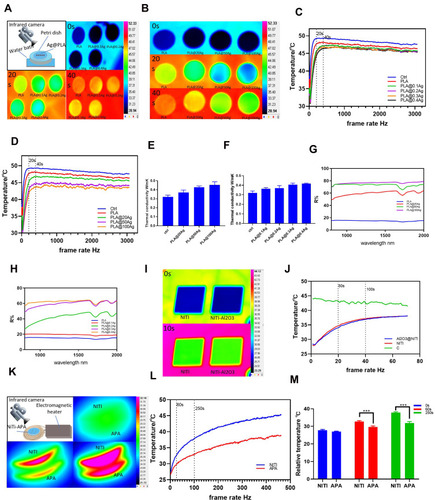
Figure 6 Excellent compatibility of APA multifunctional coating. (A–C) Viability of L929 cells incubated for 1 day, 3 days and 5 days with extracts of PLA, PLA@Ag, PLA@Ag@NiTi and NiTi. (D) Fluorescence microscopy images of L929 cells cultured on PLA and PLA@Ag film for 2h, 1 day and 3 days with actin stained with FITC (red) and the nucleus stained with PDAI (blue).
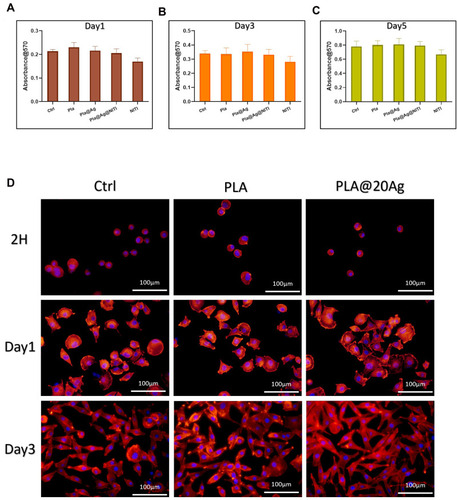
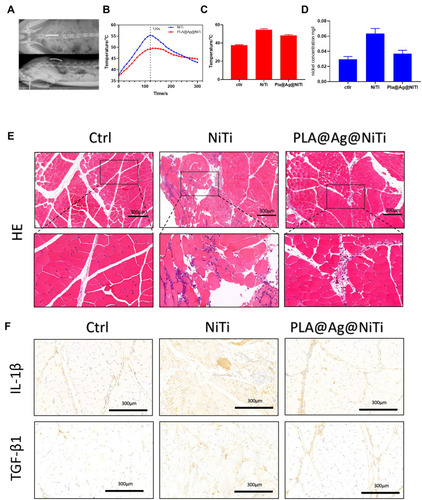
Figure 7 Actual performance of APA multifunctional coating in animals. (A) The x-ray diagram of the rabbit implanted with NiTi and APA@NiTi rods. (B, C) Temperature curve and surface temperature of NiTi and APA@NiTi rods implanted in animals by electromagnetic heating in vitro. (D) The concentration of Ni Ion in rabbit serum 14 days after the implantation of the material. (E) HE staining of muscle tissue in the sham operation group, NiTi group and APA@NiTi group 14 days after the implantation. (F) The Immunohistochemical staining of TGF- β1 and IL-1β for muscle tissue in the sham operation group, NiTi group and APA@NiTi group 14 days after the implantation.