Figures & data
Figure 1 The effects of PLGA MWs on the NPs (LA/GA 50:50) particle size and in vitro drug release.
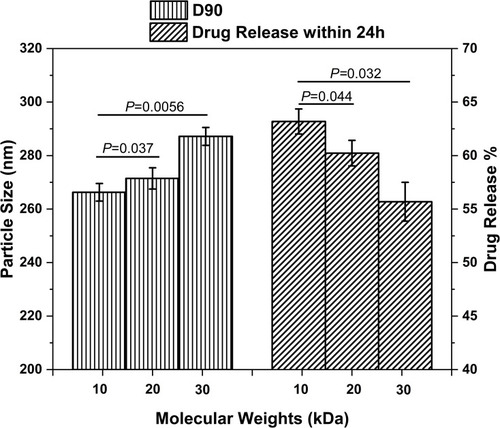
Figure 2 The effects of PLGA LA/GA ratios on in vitro drug release and corneal permeability of the NPs (MW 10,000).
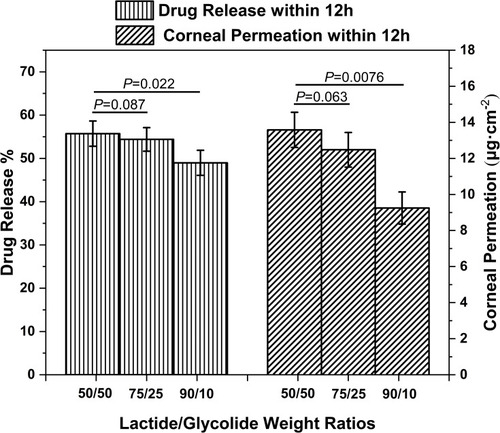
Figure 3 Differential scanning calorimetry thermograms of (A) PLGA NPs, (B) 2-HP-β-CD/PLGA NPs, (C) trehalose/PLGA NPs and (D) chitosan oligosaccharide/PLGA NPs.
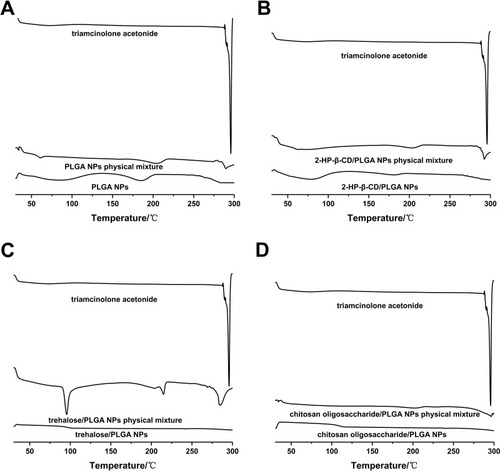
Figure 4 X-ray diffraction patterns of (A) PLGA NPs, (B) 2-HP-β-CD/PLGA NPs, (C) trehalose/PLGA NPs, and (D) chitosan oligosaccharide/PLGA NPs.
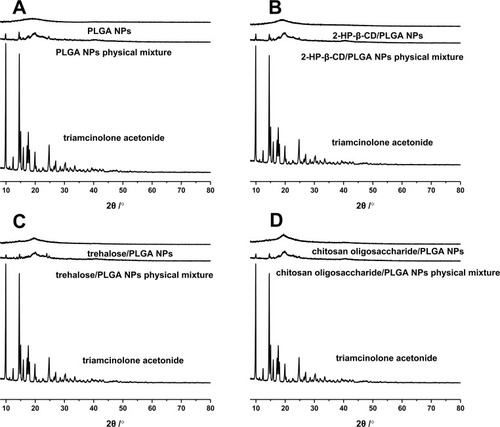
Figure 5 Infrared spectrograms of (A) PLGA NPs, (B) 2-HP-β-CD/PLGA NPs, (C) trehalose/PLGA NPs, and (D) chitosan oligosaccharide/PLGA NPs.
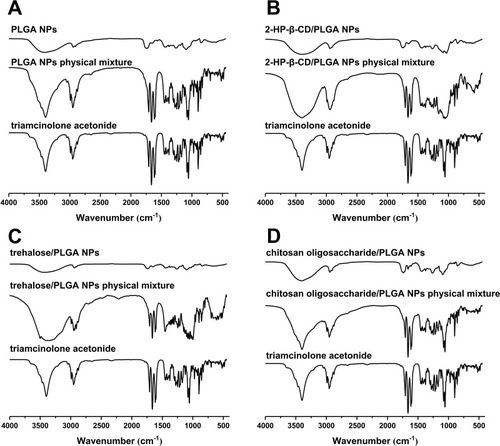
Figure 6 Particle size distribution and zeta potential of (A) PLGA NPs, (B) 2-HP-β-CD/PLGA NPs, (C) trehalose/PLGA NPs, (D) chitosan oligosaccharide/PLGA NPs.
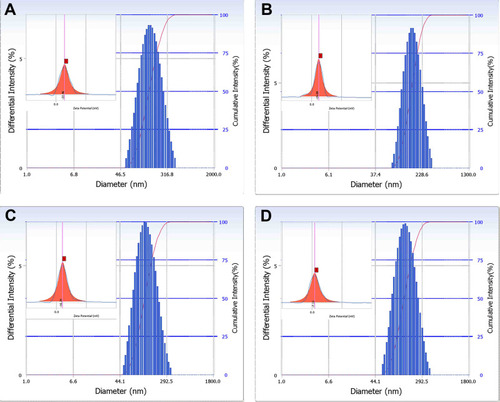
Figure 7 TEM images of (A) PLGA NPs, (B) 2-HP-β-CD/PLGA NPs, (C) trehalose/PLGA NPs, and (D) chitosan oligosaccharide/PLGA NPs.
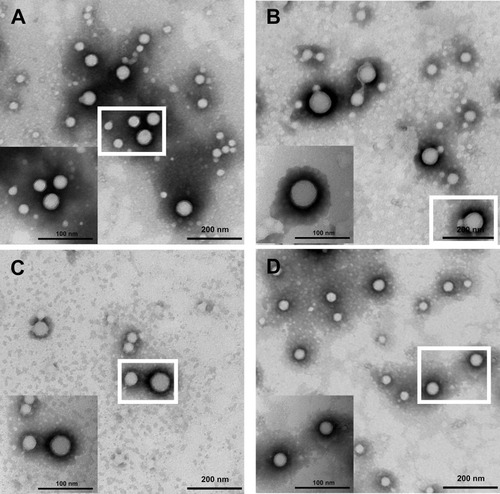
Figure 8 (A) The cumulative percentage of triamcinolone acetonide released in artificial tear fluid. (B) Permeability of triamcinolone acetonide across excised rabbit corneas (■: PLGA NPs; ▼: 2-HP-β-CD/PLGA NPs; ▲: trehalose/PLGA NPs; ●: chitosan oligosaccharide/PLGA NPs).
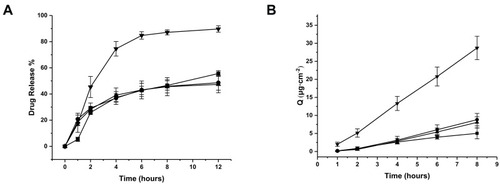
Table 1 Release Models of Triamcinolone Acetonide from Determination Preparations Across Corneas in vitro
Table 2 Permeation Parameters of the Different Preparations Through the Excised Corneas
Table 3 Pharmacokinetics Parameters of Triamcinolone Acetonide in Aqueous Humor After Topical Instillation
Figure 9 Pharmacokinetic profiles of the NPs in aqueous humor. (■: PLGA NPs; ▼: 2-HP-β-CD/PLGA NPs; ▲: trehalose/PLGA NPs; ●: chitosan oligosaccharide/PLGA NPs).
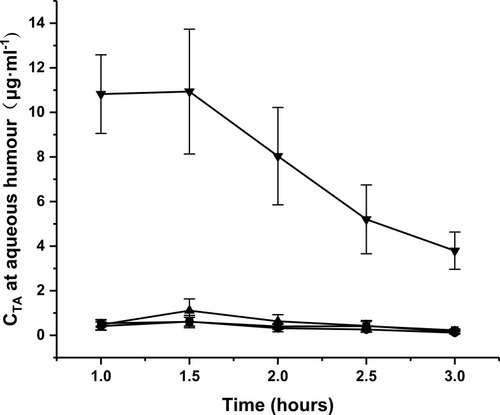
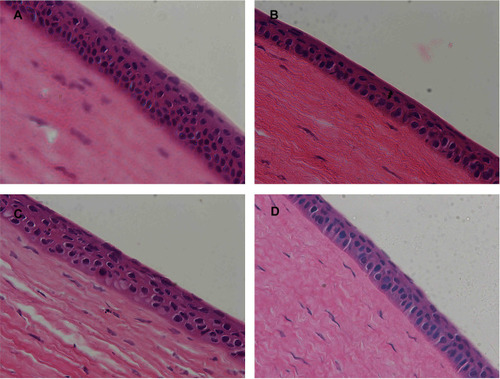
Figure 10 Histopathological images of rabbit corneas treated with (A) PLGA NPs, (B) 2-HP-β-CD/PLGA NPs, (C) trehalose/PLGA NPs, and (D) chitosan oligosaccharide/PLGA NPs.