Figures & data
Figure 1 The schematic representation of the assembly of tuftsin-bearing liposomes encapsulated with DOX and CUR.
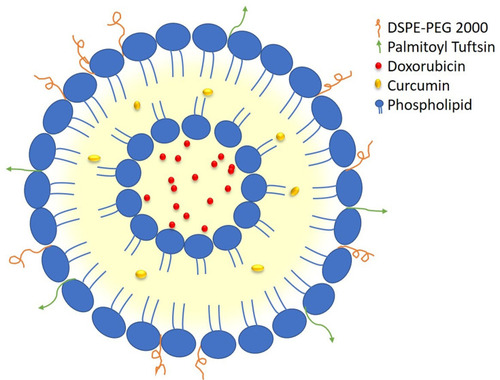
Table 1 The Size, Polydispersity Index and Entrapment Efficiency of Liposomes
Figure 2 Size determination of LPs.
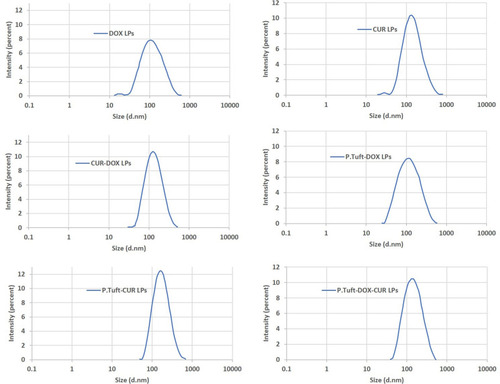
Figure 3 Characterisation of LPs.
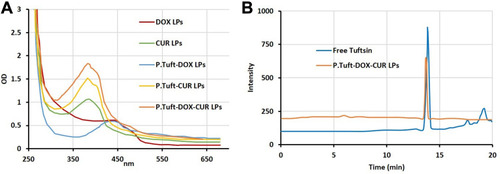
Figure 4 Characterization of structural properties by Fourier transform infrared spectroscopy (FTIR).
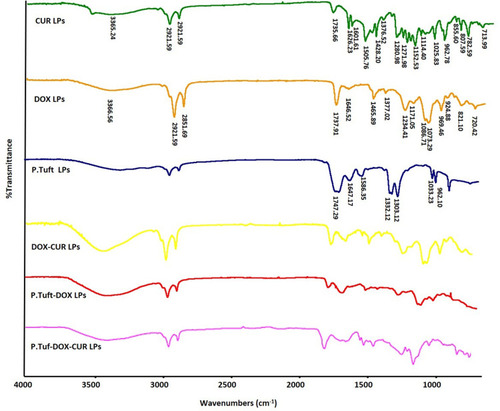
Figure 5 In vitro release profile of DOX and CUR.
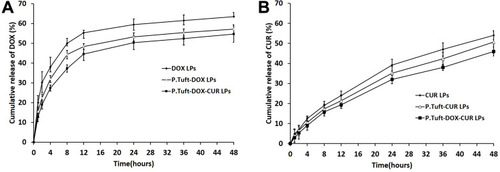
Figure 6 In vitro cellular uptake study.
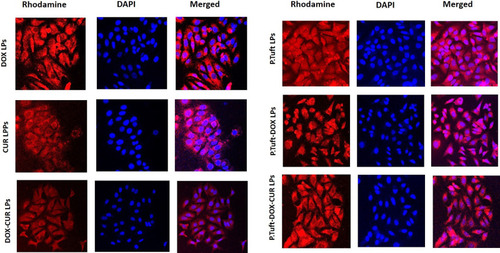
Figure 7 The in vivo effects different kinds of LPs in EAC tumor-bearing mice.
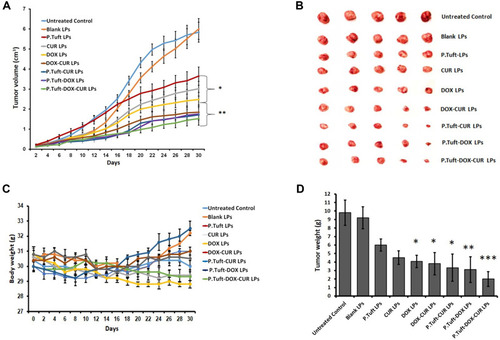
Figure 8 Apoptosis protein expression in tumor tissues.
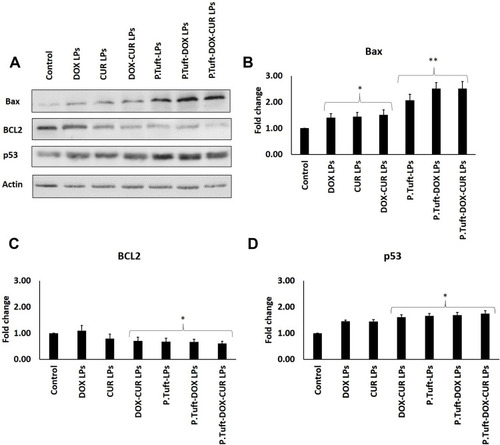
Figure 9 Schematic representation of p53-mediated apoptotic pathway.
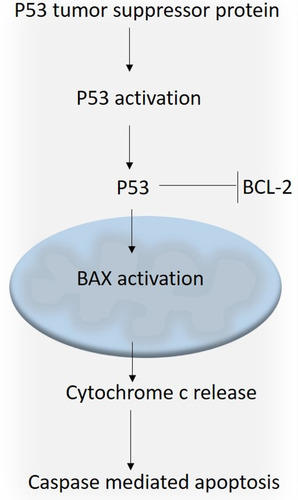
Figure 10 Assessment of liver toxicity in mice on treatment with different kinds of LPs.
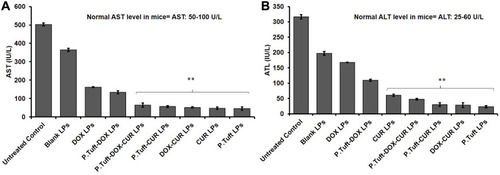
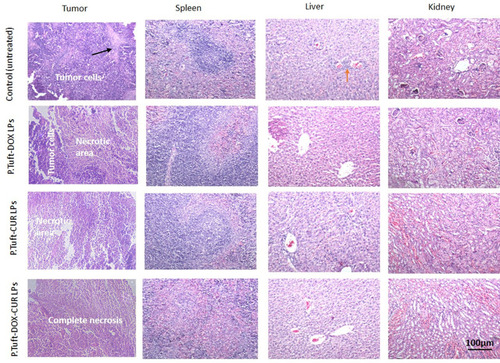
Figure 11 The micrographs of H&E-stained sections of the main organs and tumors after treatment with different kinds of LPs.