Figures & data
Table 1 List of Commercial Silver Colloidal Samples Evaluated
Figure 1 UV-Vis spectra of samples #1–10.
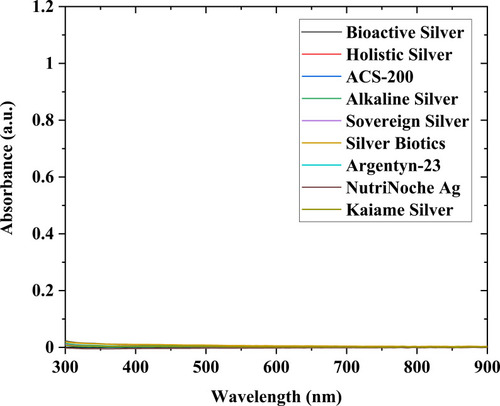
Figure 2 UV-Vis spectra of samples 11–14.
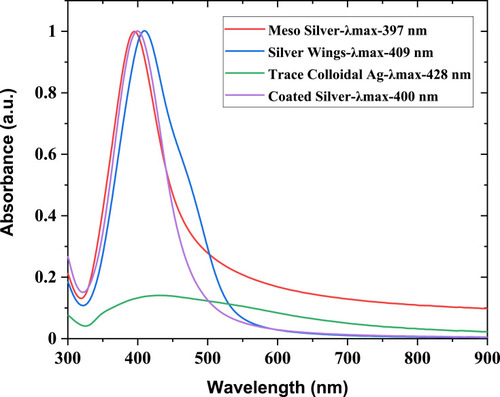
Figure 3 FESEM images of samples #12–14: (left) MesoSilver, (middle) Silver Wings, (right) Coated Silver.
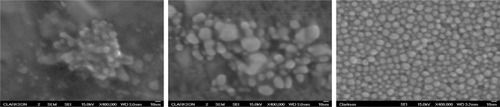
Figure 4 STEM images of samples #12–14: (left) MesoSilver, (middle) Silver Wings, (right) Coated Silver.
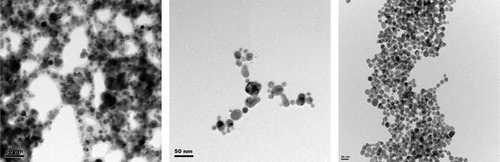
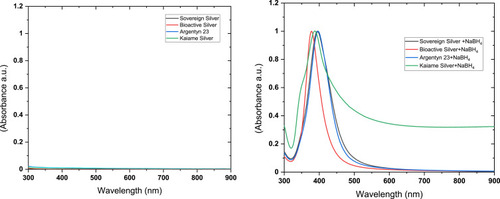
Figure 5 Images of Sovereign Silver (sample#1), Kaiame Silver (sample #4), Bio-active Silver Sol (sample#5), and Argentyn23 (sample#6) before and after the addition of sodium borohydride.
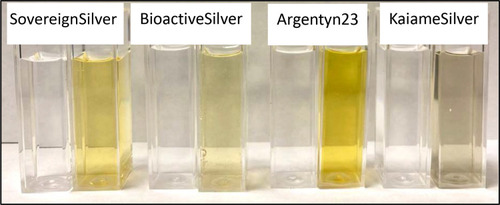
Figure 6 UV-Vis spectra of samples #1, #4, #5, and #6 before (left) and after (right) the addition of sodium borohydride.