
Figures & data
Figure 1 Chemical structures of (A) honokiol and (B) magnolol.
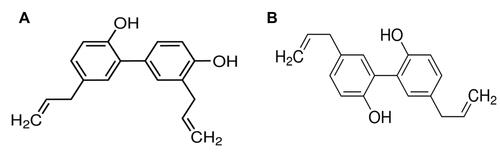
Table 1 Preliminary Screening of Mixed Polymeric Micellar Formulations with Various Ratios of Different Amphiphiles (NaDOC, PP123, PF68, PF87, PF127, PF108, and PL121, CRH40 and CELP) and Lecithin
Figure 2 Particle sizes of honokiol/magnolol micelles formed using different amphiphiles and ratios.
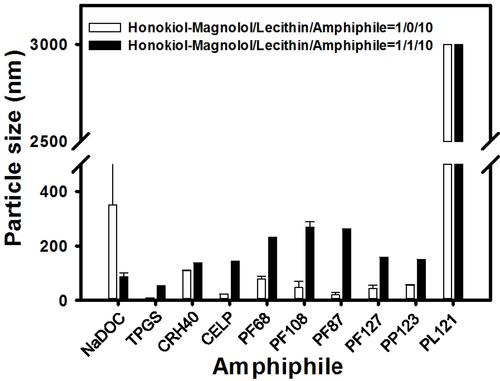
Table 2 Optimization of Honokiol/Magnolol-Loaded Lecithin-Based Mixed Micelles Formed Using NaDOC and PP123 as Amphiphilic Polymers with Lecithin at Different Ratios
Figure 3 TEM micrograph of lbMPMs[NaDOC] and lbMPMs[PP123]. (A) Honokiol/magnolol: lecithin: NaDOC in a ratio of 6:2:5. (B) Honokiol/magnolol: lecithin: PP123 in a ratio of 1:1:10.
![Figure 3 TEM micrograph of lbMPMs[NaDOC] and lbMPMs[PP123]. (A) Honokiol/magnolol: lecithin: NaDOC in a ratio of 6:2:5. (B) Honokiol/magnolol: lecithin: PP123 in a ratio of 1:1:10.](/cms/asset/45a141a1-9e79-46ba-9513-24ddef6a5edd/dijn_a_12192221_f0003_b.jpg)
Figure 4 Stability of honokiol/magnolol-loaded (lbMPMs[NaDOC]) (A) and lbMPMs[PP123] (B) stored in phosphate-buffered saline (PBS) at 4 °C and at room temperature; lbMPMs[NaDOC]) (C), lbMPMs[PP123] (D) in PBS or FBS at 37 °C.
![Figure 4 Stability of honokiol/magnolol-loaded (lbMPMs[NaDOC]) (A) and lbMPMs[PP123] (B) stored in phosphate-buffered saline (PBS) at 4 °C and at room temperature; lbMPMs[NaDOC]) (C), lbMPMs[PP123] (D) in PBS or FBS at 37 °C.](/cms/asset/d4fe3cbc-227a-4367-b158-c9e2477da81d/dijn_a_12192221_f0004_b.jpg)
Figure 5 In vitro release profiles of honokiol (A) and magnolol (B) from/magnolol Honokiol/magnolol: lecithin: NaDOC in a ratio of 6:2:5 (lbMPMs[NaDOC]) and honokiol/magnolol: lecithin: PP123 in a ratio of 1:1:10 (lbMPMs[PP123]).
![Figure 5 In vitro release profiles of honokiol (A) and magnolol (B) from/magnolol Honokiol/magnolol: lecithin: NaDOC in a ratio of 6:2:5 (lbMPMs[NaDOC]) and honokiol/magnolol: lecithin: PP123 in a ratio of 1:1:10 (lbMPMs[PP123]).](/cms/asset/1144db32-c8ee-4b27-b6a6-1e3b521012b4/dijn_a_12192221_f0005_c.jpg)
Table 3 Summary of Pharmacokinetic Parameters for Honokiol Following Intravenous and Oral Administration of Lecithin-Based Mixed Polymeric Micelles (NaDOC and PP123) and Free Honokiol-Magnolol (n=3)
Table 4 Summary of Pharmacokinetic Parameters for Magnolol Following Intravenous and Oral Administration of Lecithin-Based Mixed Polymeric Micelles (NaDOC and PP123) and Free Honokiol-Magnolol (n=3)
Figure 6 Plasma concentration-time curves of honokiol ((A): 0–72h; (B):0–12h) and magnolol ((C): 0–72h; (D): 0–12h) after intravenous administration of lbMPMs[NaDOC], lbMPMs[PP123] and free honokiol-magnolol (20 mg/kg) to rats. Each point represents the mean±SD of three determinations (n=3).
![Figure 6 Plasma concentration-time curves of honokiol ((A): 0–72h; (B):0–12h) and magnolol ((C): 0–72h; (D): 0–12h) after intravenous administration of lbMPMs[NaDOC], lbMPMs[PP123] and free honokiol-magnolol (20 mg/kg) to rats. Each point represents the mean±SD of three determinations (n=3).](/cms/asset/9e28a242-a453-46e1-b88f-050c0f38ab38/dijn_a_12192221_f0006_c.jpg)
Figure 7 Plasma concentration-time curves of honokiol ((A): 0–72h; (B): 0–8h) and magnolol ((C): 0–72h; (D):0–8h) after oral administration of lbMPMs[NaDOC], lbMPMs[PP123] and free honokiol-magnolol at a single dose of 40 mg/kg to rats. Each point represents the mean±SD of three determinations (n=3).
![Figure 7 Plasma concentration-time curves of honokiol ((A): 0–72h; (B): 0–8h) and magnolol ((C): 0–72h; (D):0–8h) after oral administration of lbMPMs[NaDOC], lbMPMs[PP123] and free honokiol-magnolol at a single dose of 40 mg/kg to rats. Each point represents the mean±SD of three determinations (n=3).](/cms/asset/b6af793d-bb78-46cf-8509-b29a7b525a4f/dijn_a_12192221_f0007_c.jpg)