Figures & data
Figure 1 Preparation of CS-CDs.
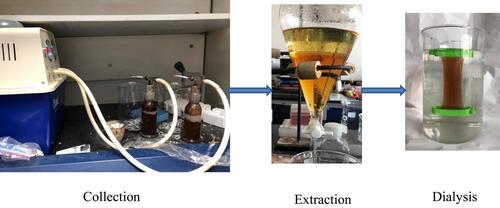
Figure 2 Characterisation of CS-CDs. (A) HRTEM images of CS-CDs displaying ultra-small particles. Inset: electron diffraction image of selected area. (B) HRTEM images of CS-CDs. Inset: histogram depicting particle size distribution. (C) HRTEM images of CS-CDs. Inset: line profiles of the corresponding HRTEM images of CS-CDs. (D) Images obtained using 365-nm light. (E) UV–vis and (F) fluorescence spectra.
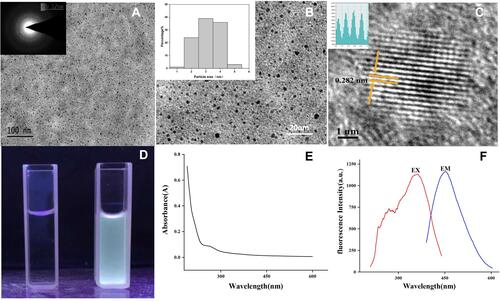
Figure 3 (A) Raman spectrum of CS-CDs. (B) XRD pattern spectrum of CS-CDs. (C) FTIR spectra of CS-CDs.
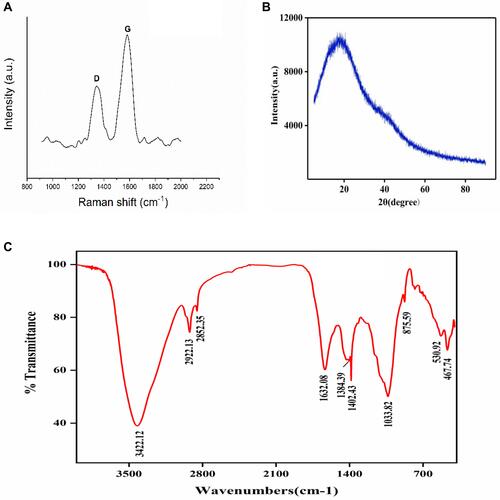
Figure 4 XPS of CS-CDs. (A) XPS survey spectra. (B) C 1s, (C) N1s, (D) O 1s,(E) P2p, (F) S2p XPS spectra.
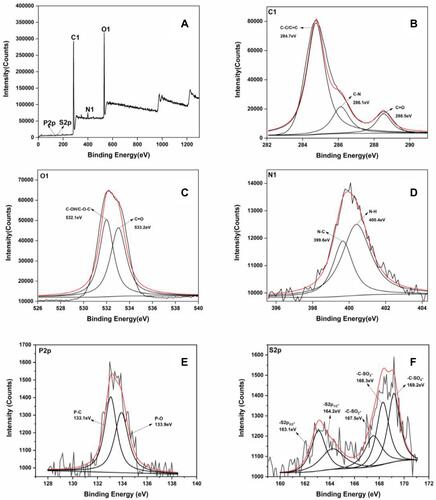
Figure 5 HPLC chromatograms of CS-CDs (A) before purification, and (B) after purification.
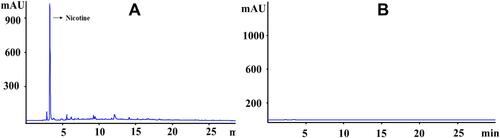
Figure 6 RAW 264.7 cell viability after incubation with various concentrations of cigarettes smoke carbon dots (CS-CDs), PBS (negative control) or nicotine (positive control) for 24 h The cell viability of RAW 264.7 cells was calculated by the OD of the sample minus the OD of the negative control, PBS, then divided by the OD of the negative control, and then multiplied by 100. The value of cell activity was greater than zero, indicating that it can promote cell proliferation, and less than zero, indicating that it can inhibit cell proliferation.
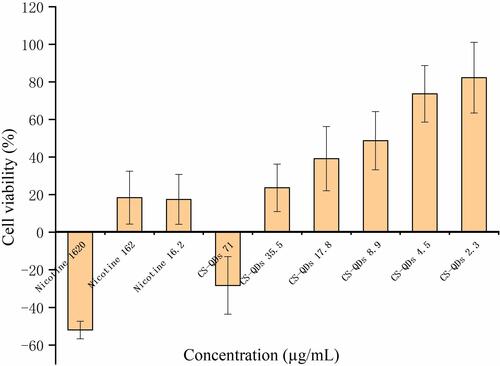
Figure 7 Effect of CS-CDs on the (A) time spent in the open arms of the elevated plus maze, (B) number of entries into open arms, (C) percentage of entries into open arms, and (D) time spent in the central area in the OFT. The results are presented as mean ± SD and significant difference compared with NS (*p<0.05; **p<0.01).
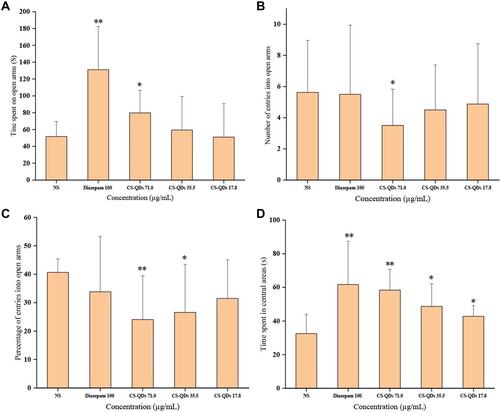
Figure 8 Effect of cigarettes smoke carbon dots (CS-CDs) on serum CRF (A), ACTH (B), CORT (C) and DA (D) after behavioural tests.
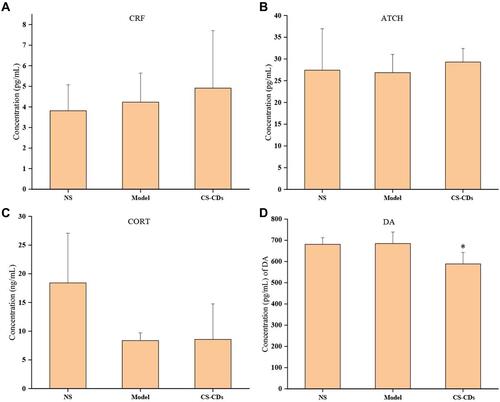
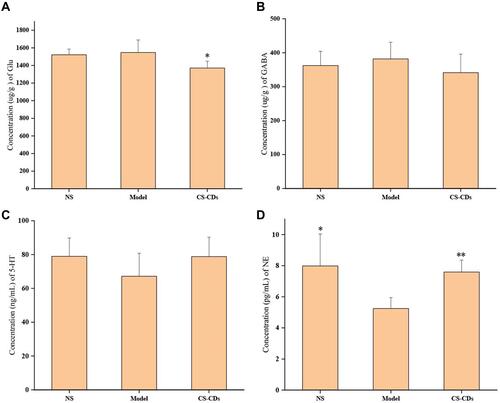
Figure 9 The concentration of Glu (A), GABA (B), 5-HT (C) and NE (D) in mice brains. The results are presented as mean ± SD and significant difference compared with model (*p<0.05; **p<0.01).