Figures & data
Figure 1 X-ray diffraction patterns of Nanocomposite-A (red), Nanocomposite-B, MgLH and PAS free drug (A) and the spatial orientation of PAS into the MgLH interlayer gallery (B).
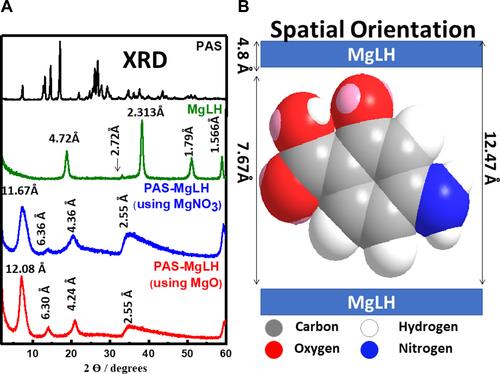
Table 1 FTIR Assignments (in nm) of PAS and Its Nanocomposites (A and B)
Figure 2 FTIR Spectra of PAS, MgLH, and its nanocomposites.
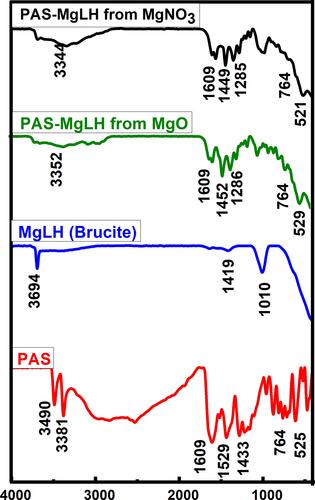
Figure 3 Transmission electron micrographs of Nanocomposite-A (A), Nanocomposites-B (B) and particle size distribution of Nanocomposite-A (C) and Nanocomposite-B (D).
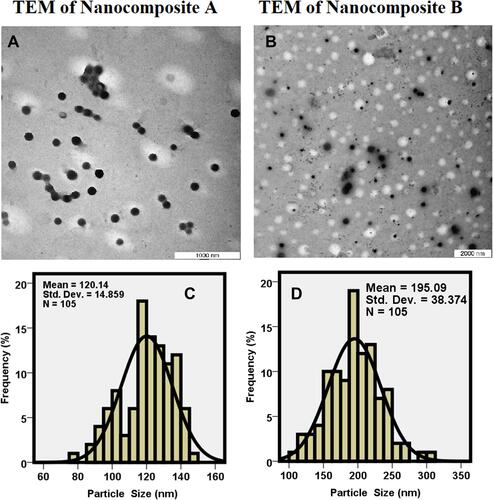
Figure 4 (A and B) show the hydrodynamic size for Nanocomposite-A and Nanocomposite-B, respectively.
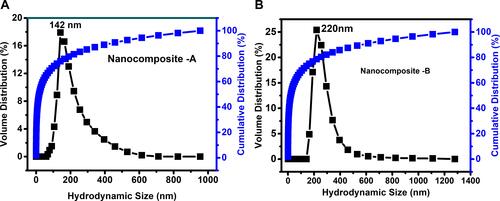
Figure 5 In vitro release of PAS from nanocomposite-A (A) and nanocomposite-B (B) in phosphate buffer saline solutions of pH 7.4 and pH 4.8.
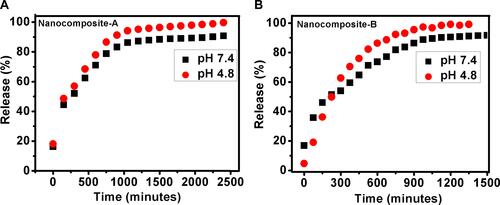
Figure 6 Minimum inhibitory concentrations (µg/mL) (MICs) of the PAS nanocomposites as compared to the PAS free drug against Mycobacterium tuberculosis as determined using the Mycobacteria Growth Indicator Tube (MGIT) with BACTEC MGIT 960 growth supplement for drug susceptibility testing and measured by the MGIT 960 instrument (Becton Dickinson Diagnostic Systems, Sparks, MD, USA).
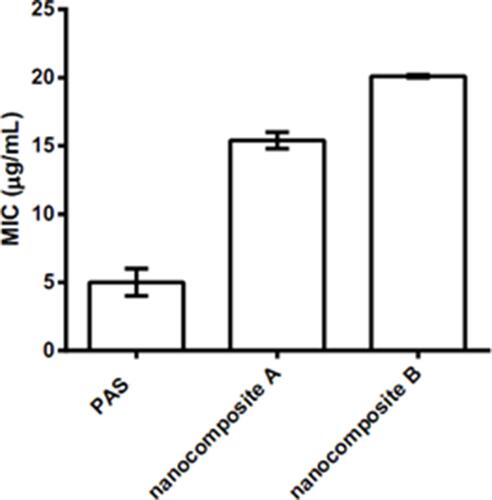
Figure 7 Antimicrobial effects of PAS free drug and PAS nanocomposites, Nanocomposite-A and Nanocomposite-B against different microorganisms, showing the inhibition of microbial growth using the plate colony-forming unit (CFU) counting method at two different concentrations: (A) 1 mg and (B) 2 mg.
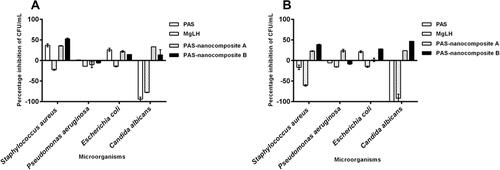
Figure 8 (A) Incubation of 3T3 cells after 72 hours up to a concentration of 100 μg/mL. (B) Incubation of human normal lung MRC-5 cells in the presence of the nanocomposite after 72 hours.
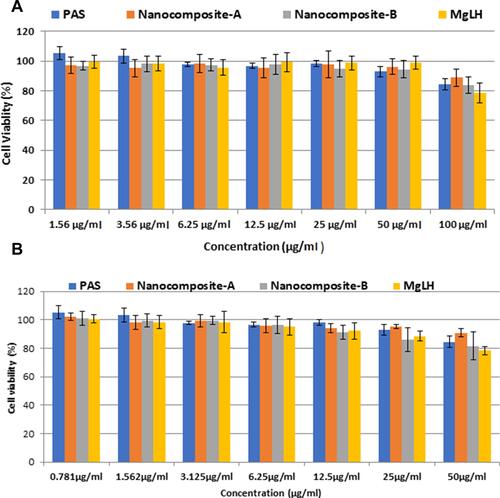
Figure 9 Effects of nanoparticles on RAW 264.7 macrophage viability. Macrophages at a cell density of 1×10⁴ cells/well were seeded in a 96 well plate and treated with the indicated nanoparticle concentrations for 24 h. The data are presented as mean ± SD of three independent experiments.
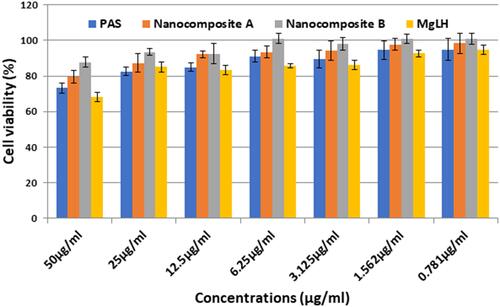
Figure 10 Effects of nanoparticles on NO production in LPS- induced RAW 264.7 macrophages. Macrophages at a cell density of 1×10⁶ cells/well in the presence or absence of LPS were seeded in a 6 well plate and treated with the indicated concentrations of nanoparticles and dexamethasone for 24 h. The supernatants were collected and investigated by the Griess assay. The data are presented as mean ± SD of three independent experiments. The control is the base level of nitrite released without LPS induction. #p<0.001 LPS-treated group vs Control and *p< 0.01 treated group significantly different from LPS-treated group.
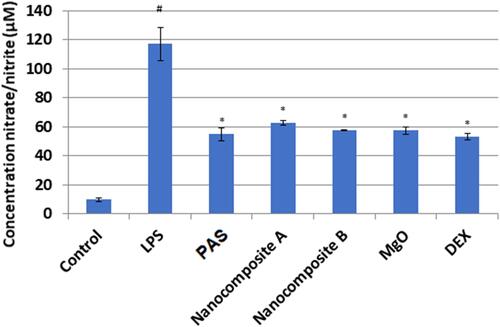
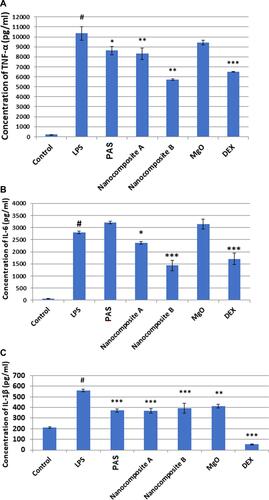
Figure 11 (A–C) Effect of nanoparticles on the production of the cytokines TNF-α, IL-6 and lL-1β in LPS- induced RAW 264.7 macrophages. A density of 1×10⁶ cells/well of macrophages induced by LPS was seeded in 6 well plates and treated with the indicated concentrations of a flower extract and dexamethasone for 24 h. The supernatants were collected and analyzed by ELISA kits. The data are presented as the mean ± SD of three independent experiments. #p< 0.001, LPS–treated group vs Control, ***p< 0.001, **p< 0.01 and *p< 0.05 treated group significantly different from the LPS-treated group. Control is the basal level of cytokines released without LPS induction.