Figures & data
Figure 1 Characterization of sEV-AT. (A) Representative images of sEV-AT with transmission electron microscopy. Scale bar=100 nm. (B) The particle size distribution of sEV-AT was measured by ZataView analysis. (C) Western blot analysis of exosomal markers, CD63, CD9, and HSP70. Actin was cellular protein as a control. (D) Uptake analysis of sEV-AT by HUVECs (red: phalloidin, green: DiO-labeled sEV-AT, blue: nuclei). Scale bar=20 µm.
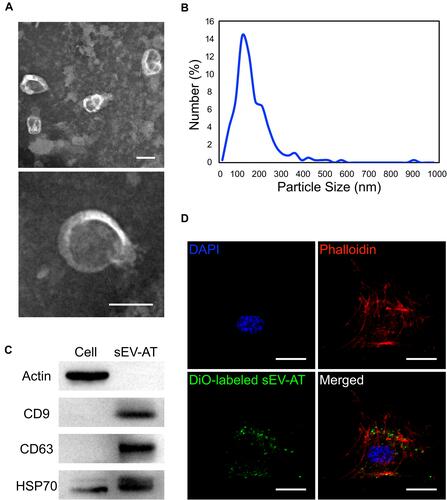
Figure 2 Biodistribution of DiR-labeled sEV-AT to maxilla. Ex vivo images of maxillae from rats after intravenous injection of DiR-labeled sEV-AT.
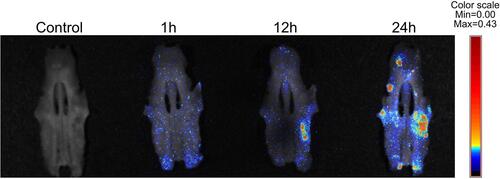
Figure 3 Effects of sEV-AT injection on rat BRONJ model. (A) Development of rat BRONJ model and schedule of sEV-AT injection (Control: natural healing group; Zol+Dex: Zol+Dex and saline treated group; sEV-AT: Zol+Dex and sEV-AT treated group). (B) Representative intraoral photos. Scale bar=1mm. (C) Open area without epithelium coverage. Open area was significantly decreased by sEV-AT treatment (***p<0.001). (D) Representative μCT images of tooth extraction sockets (red dotted lines: tooth extraction sockets). Scale bar=1mm. (E) Quantification of BV/TV, Tb.N, Tb.Th and Tb.Sp in each group (***p<0.001).

Figure 4 Histological analysis of tooth extraction sockets in each group (Control: natural healing group; Zol+Dex: Zol+Dex and saline treated group; sEV-AT: Zol+Dex and sEV-AT treated group). (A) Representative HE-stained images of tooth extraction sockets (black dotted line: tooth extraction sockets, red dotted line: necrotic bones, black square: areas were magnified). Scale bar=1mm (upper), scale bar=100 µm (lower). (B) The percentage of empty osteocyte lacunae (***p < 0.001). (C) Representative TRAP-stained images of tooth extraction sockets (white arrowhead: TRAP positive cells). Scale bar=50 µm. (D) The number of TRAP positive cells per linear bone perimeter (***p < 0.001). (E) Representative masson’s trichrome-stained images of tooth extraction sockets (black dotted line: tooth extraction sockets of mesial roots). Scale bar=500 µm. (F) The area percentage of collagen fibers (***p < 0.001). (G) Representative anti-VEGFA immunohistochemical images of tooth extraction sockets (white arrowhead: VEGFA positive blood vessels). Scale bar=100 µm. (H) The number of VEGFA positive blood vessels (***p < 0.001).
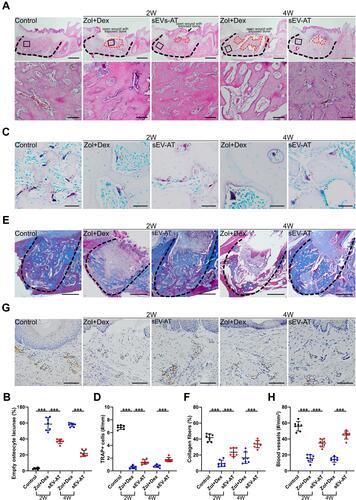
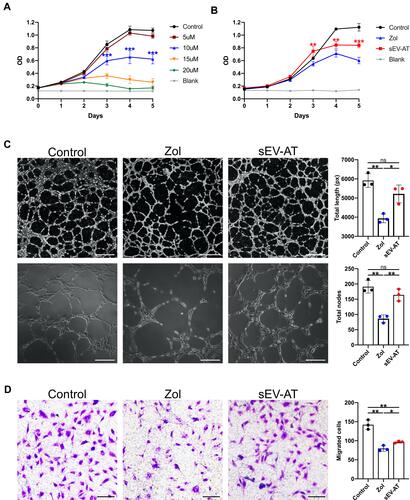
Figure 5 Effects of sEV-AT and Zol on HUVECs. (A) Effects of Zol at different concentration on HUVECs proliferation (***p < 0.001). (B) Proliferation curves of HUVECs in each group (Control: ECM; Zol: ECM+Zol; sEV-AT: ECM+Zol+sEV-AT) (**p<0.01, ***p<0.001). (C) Representative tube-like structures of HUVECs in each group. Scale bar=200 µm (upper), scale bar=500µm (lower). Total length and total nodes of all tubing per field of view from three individual experiments (ns: P>0.05, *p<0.05, **p<0.01). (D) Representative microscope images of migrated HUVECs in each group. Scale bar=100µm. Migrated cells per field of view from three individual experiments (*p<0.05, **p<0.01).