Figures & data
Figure 1 Characterization of CeO2 NPs by transmission electron microscopy (TEM), showing nanoparticles with average diameters of (A) 15 ± 5 nm, (B) 30 ± 5 nm, and (C) 45 ± 5 nm. (Left image scale bar: 50 nm and right image scale bar: 10 nm).
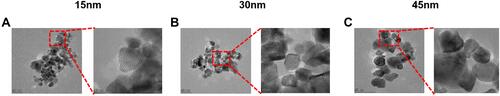
Figure 2 CeO2 NPs induced cytotoxicity in ARPE-19 cells. ARPE-19 cells were exposed to different concentrations (3.125–100 μg/mL) of CeO2 NPs for (A, C and E) 24 h and (B, D and F) 48 h before measurements of (A and B) ATP content, (C and D) LDH release and (E and F) cytotoxicity determined using the MTS assay. Data points represent the mean ± SD from three independent experiments with three samples per concentration in each experiment. *p < 0.05 compared to controls.
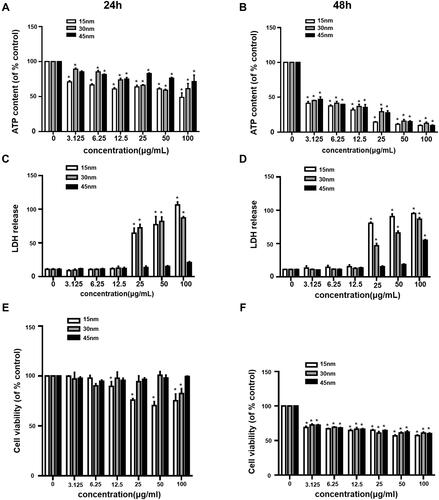
Figure 3 CeO2 NPs induced morphological changes in cells. Morphological changes of ARPE-19 cells were observed via microscopy following 24 h and 48 h of exposure to CeO2 NPs with indicated concentrations. (Scale bar: 25 μm.).
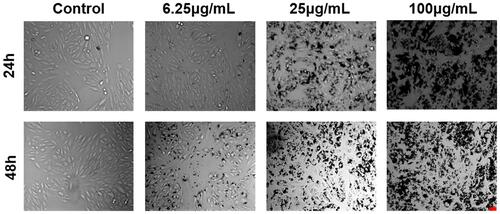
Figure 4 CeO2 NPs induced ROS generation. (A) ROS levels were measured at 6, 12, 24 and 48 h after exposure to various concentrations (3.125–100 μg/mL) of CeO2 NPs by H2DCF-DA staining. (B) ROS levels were monitored under CLSM, which showed that ROS levels increased following 6, 12, 24, and 48 h of exposure to CeO2 NPs with concentrations of 25 and 100 μg/mL. Data points represent the mean ± SD from three independent experiments with three samples per concentration. *p < 0.05 compared to controls. (Scale bar: 25 μm.).
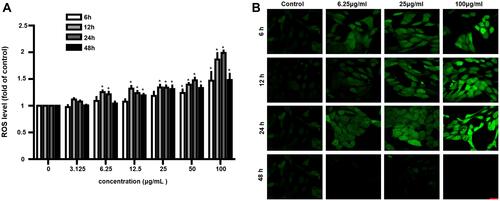
Figure 5 CeO2 NPs induce mitochondrial dysfunction. ARPE-19 cells were treated with three concentrations (6.25, 25 and 100 μg/mL) of CeO2 NPs for 24 h (A) and 48 h (B). JC-1 staining was performed to assess mitochondrial membrane potential. (Scale bar: 25 μm.).
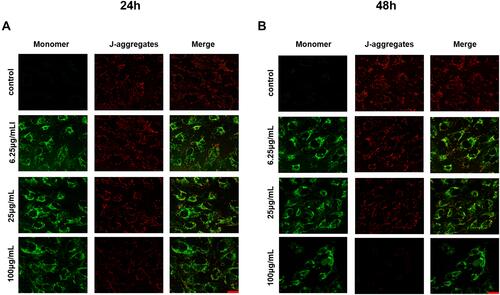
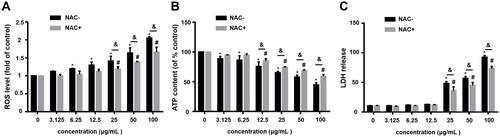
Figure 6 NAC pretreatment alleviates CeO2 NPs-induced cytotoxicity. (A) Intracellular ROS levels were measured after a 12-h CeO2 NPs treatment with and without 1-h pretreatment of 10 mM NAC. (B and C) ATP content and LDH release were evaluated after a 24-h CeO2 NPs treatment with and without 1-h pretreatment of 10 mM NAC. The data points represent the mean ± SD from at least three independent experiments. *,#p < 0.05 compared to the vehicle control without or with NAC pretreatment, respectively. &p < 0.05 between the treatments with and without NAC pretreatment at the same concentration of CeO2 NPs.