Figures & data
Figure 1 Chemical structures of (A) dipalmitoylphosphatidylcholine and (B) dipalmitoylphosphatidylethanolamine methoxy-poly(ethylene glycol).
Notes: n = 45, 67, and 113 for 2000, 3000, and 5000 MW poly(ethylene glycol), respectively, where n denotes the number of ethylene glycol oligomers present.
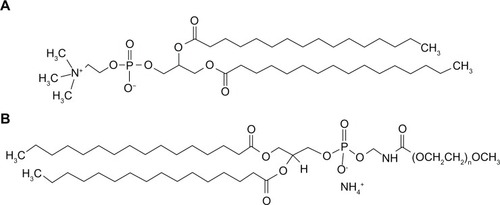
Table 1 Formulated spray-dried and co-spray-dried particle systems, their corresponding DPPC and/or DPPE-PEG amounts, and spray-drying conditions where low P, medium P, and high P correspond to 10%, 50%, and 100% pump rates, respectively
Table 2 Particle-size parameters of spray-dried DPPC and co-spray-dried DPPC:DPPE-PEG particles (mean ± standard deviation)
Figure 2 (A–D) Scanning electron micrographs of raw dipalmitoylphosphatidylcholine (DPPC) and spray-dried 100 DPPC particles at three pump rates. (A) Raw DPPC, magnification 1000×; (B) DPPC particles at 10% (low P) pump rate, magnification 10,000×; (C) DPPC particles at 50% (medium P) pump rate, magnification 10,000×; (D) DPPC particles at 100% (high P) pump rate, magnification 10,000×.
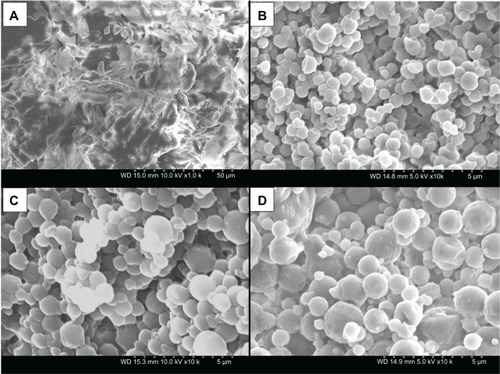
Figure 3 (A–D) Scanning electron micrographs of raw dipalmitoylphosphatidylethanolamine poly(ethylene glycol)-2k 95 DPPC:5 DPPE-PEG2k and co-spray-dried 95 dipalmitoylphosphatidylcholine (DPPC):5 DPPE-PEG 2k particles at three pump rates. (A) Raw DPPE-PEG2k, magnification 1000×; (B) 95 DPPC:5 DPPE-PEG2k particles at 10% (low P) pump rate, magnification 10,000×; (C) 95 DPPC:5 DPPE-PEG2k particles at 50% (medium P) pump rate, magnification 10,000×; (D) 95 DPPC:5 DPPE-PEG2k particles at 100% (high P) pump rate, magnification 10,000×.
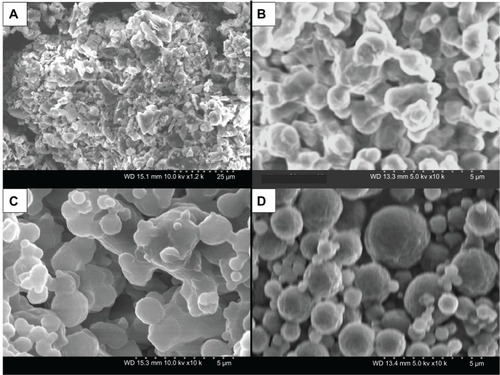
Figure 4 (A–D) Scanning electron micrographs of raw dipalmitoylphosphatidylethanolamine poly(ethylene glycol)-3k (DPPE-PEG3k) and co-spray-dried 95 dipalmitoylphosphatidylcholine (DPPC):5 DPPE-PEG3k particles at three pump rates. (A) Raw DPPE-PEG3k, magnification 1000×; (B) 95 DPPC:5 DPPE-PEG3k particles at 10% (low P) pump rate, magnification 10,000×; (C) 95 DPPC:5 DPPE-PEG3k particles at 50% (medium P) pump rate, magnification 10,000×; (D) 95 DPPC:5 DPPE-PEG3k particles at 100% (high P) pump rate, magnification 10,000×.
Figure 5 (A–D) Scanning electron micrographs of raw dipalmitoylphosphatidylethanolamine poly(ethylene glycol)-5k (DPPE-PEG5k) and co-spray-dried 95 dipalmitoylphosphatidylcholine (DPPC):5 DPPE-PEG 5k particles at three pump rates. (A) Raw DPPE-PEG5k, magnification 1000×; (B) 95 DPPC:5 DPPE-PEG 5k particles at 10% (low P) pump rate, magnification 10,000×; (C) 95 DPPC:5 DPPE-PEG 5k particles at 50% (medium P) pump rate, magnification 10,000×; (D) 95 DPPC:5 DPPE-PEG 5k particles at 100% (high P) pump rate, magnification 10,000×.
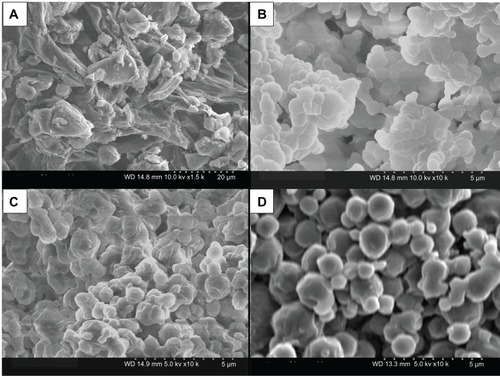
Figure 6 Powder X-ray diffractograms of: (A) formulated spray-dried (SD) dipalmitoylphosphatidylcholine (DPPC) particles at three pump rates versus raw DPPC; (B) formulated co-SD DPPC: dipalmitoylphosphatidylethanolamine poly(ethylene glycol)-2k (DPPE-PEG2k) particles at three pump rates versus raw DPPC and raw DPPE-PEG2k; (C) formulated co-SD DPPC:DPPE-PEG3k particles at three pump rates versus raw DPPC and raw DPPE-PEG3k; (D) formulated co-SD DPPC:DPPE-PEG5k particles at three pump rates versus raw DPPC and raw DPPE-PEG5k.
Note: Low P, med P, and high P correspond to 10%, 50%, and 100% pump rates, respectively.
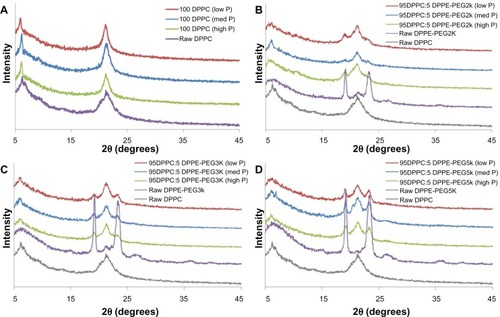
Figure 7 Differential scanning calorimetry thermograms of: (A) formulated spray-dried (SD) dipalmitoylphosphatidylcholine (DPPC) particles at three pump rates versus raw DPPC; (B) formulated co-SD DPPC:dipalmitoylphosphatidylethanolamine poly(ethylene glycol)-2k (DPPE-PEG2k) particles at three pump rates versus raw DPPE-PEG2k; (C) formulated co-SD DPPC:DPPE-PEG3k particles at three pump rates versus raw DPPE-PEG3k; (D) formulated co-SD DPPC:DPPE-PEG5k particles at three pump rates versus raw DPPE-PEG5k.
Note: Low P, med P, and high P correspond to 10%, 50%, and 100% pump rates, respectively.
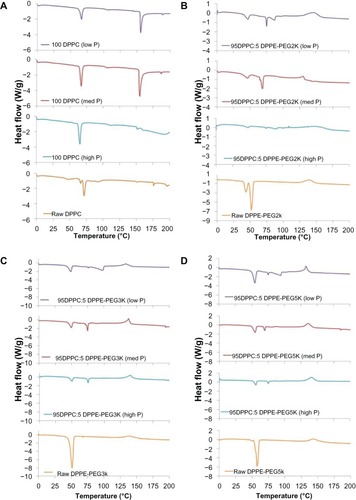
Table 3 Water content of formulated spray-dried DPPC and co-spray-dried DPPC:DPPE-PEG particles and their raw counterparts analyzed via Karl Fischer coulometric titration (mean ± standard deviation, n = 3)
Figure 8 Representative hot-stage micrographs for raw dipalmitoylphosphatidylethanolamine poly(ethylene glycol)-3k.
Note: Scale bar = 3 mm.
Figure 9 Representative hot-stage micrographs for co-spray-dried 95 dipalmitoylphosphatidylcholine:5 dipalmitoylphosphatidylethanolamine poly(ethylene glycol)-3k (high P) particles.
Note: Scale bar = 3 mm.
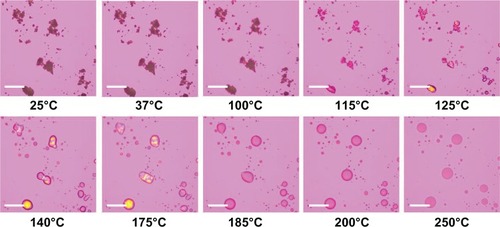
Figure 10 Attenuated total-reflectance Fourier-transform infrared spectra of: (A) formulated spray-dried (SD) dipalmitoylphosphatidylcholine (DPPC) particles at three pump rates versus raw DPPC; (B) formulated co-SD DPPC:dipalmitoylphosphatidylethanolamine poly(ethylene glycol)-2k (DPPE-PEG2k) particles at three pump rates versus raw DPPC and raw DPPE-PEG2k; (C) formulated co-SD DPPC:DPPE-PEG3k particles at three pump rates versus raw DPPC and raw DPPE-PEG3k; (D) formulated co-SD DPPC:DPPE-PEG5k particles at three pump rates versus raw DPPC and raw DPPE-PEG5k.
Note: Low P, med P, and high P correspond to 10%, 50%, and 100% pump rates, respectively.
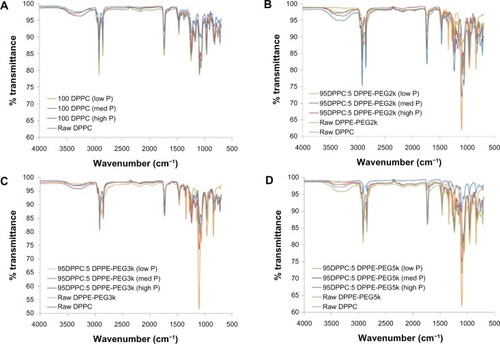
Figure 11 (A) Raman spectra obtained via confocal microscopy of raw dipalmitoylphosphatidylcholine (DPPC) and formulated spray-dried (SD) DPPC at 100% pump rate. The colored arrowhead shows the mapped bands. (B) Raman spectroscopic mapping showing the area of the Raman bands between 1400 and 1520 cm−1 (brighter-red colors indicate greater area) superimposed on a bright-field optical image of the surface of a particle of formulated SD DPPC (100% pump rate).
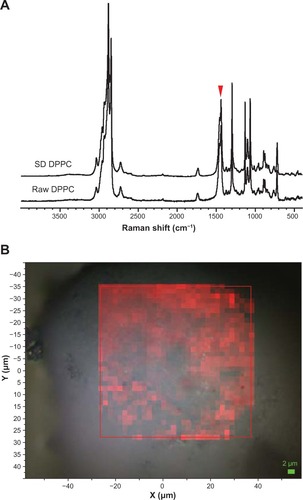
Figure 12 (A) Raman spectra obtained via confocal microscopy of raw dipalmitoylphosphatidylethanolamine poly(ethylene glycol)-2k (DPPE-PEG2k), formulated spray-dried (SD) dipalmitoylphosphatidylcholine (DPPC), and formulated co-SD 95 DPPC:5 DPPE-PEG2k (high P). Colored arrowheads show mapped bands. (B) Raman spectroscopic mapping showing the area of the Raman bands between 700 and 740 cm−1 (brighter colors indicate greater area) superimposed on a bright-field optical image of the surface of a particle of formulated SD DPPC (100% pump rate). (C) Map showing the area of the Raman bands between 270 and 295 cm−1. (D) Map showing the area of the Raman bands between 1225 and 1250 cm−1.
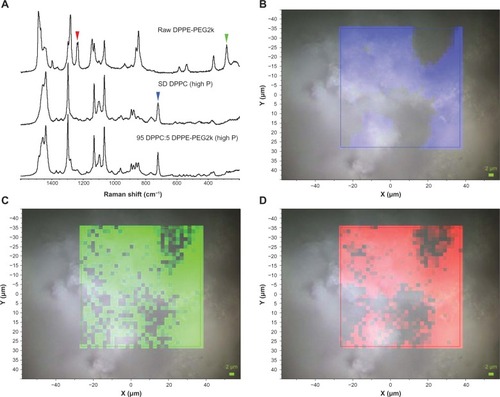
Figure 13 (A) Raman spectra obtained via confocal microscopy of raw dipalmitoylphosphatidylethanolamine poly(ethylene glycol)-3k (DPPE-PEG3k), formulated spray-dried (SD) dipalmitoylphosphatidylcholine (DPPC), and formulated co-SD 95 DPPC:5 DPPE-PEG3k (high P). Colored arrowheads show mapped bands. (B) Raman spectroscopic mapping showing the area of the Raman bands between 700 and 740 cm−1 (brighter colors indicate greater area) superimposed on a bright-field optical image of the surface of a particle of formulated SD DPPC (100% pump rate). (C) Map showing the area of the Raman bands between 270 and 295 cm−1. (D) Map showing the area of the Raman bands between 1225 and 1250 cm−1.
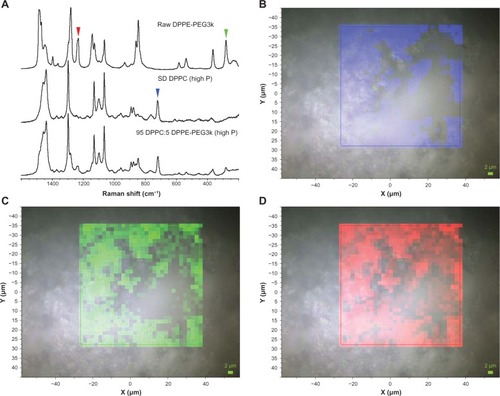
Figure 14 (A) Raman spectra obtained via confocal microscopy of raw dipalmitoylphosphatidylethanolamine poly(ethylene glycol)-5k (DPPE-PEG5k), formulated spray-dried (SD) dipalmitoylphosphatidylcholine (DPPC), and formulated co-SD 95 DPPC:5 DPPE-PEG5k (high P). Colored arrowheads show mapped bands. (B) Raman spectroscopic mapping showing the area of the Raman bands between 700 and 740 cm−1 (brighter colors indicate greater area) superimposed on a bright-field optical image of the surface of a particle of formulated SD DPPC (100% pump rate). (C) Map showing the area of the Raman bands between 270 and 295 cm−1. (D) Map showing the area of the Raman bands between 1225 and 1250 cm−1.
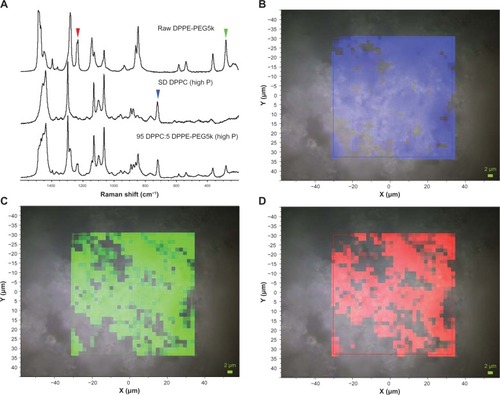
Figure 15 Aerosol-dispersion performance as % deposition on each stage of the Next Generation Impactor at Q = 60 L/minute for: (A) 100 dipalmitoylphosphatidylcholine (DPPC) (high P), (B) 95 DPPC:5 dipalmitoylphosphatidylethanolamine poly(ethylene glycol)-2k (DPPE-PEG2k) (high P), (C) 95 DPPC:5 DPPE-PEG3k (high P), and (D) 95 DPPC:5 DPPE-PEG5k (high P).
Note: High P correspond to 100% pump rate.
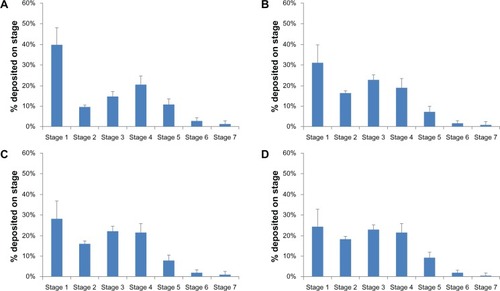
Table 4 Aerosol dispersion performance properties as aerosolized dry powders of PEGylated phospholipid particles including mass median aerodynamic diameter (MMAD), geometric standard deviation (GSD), fine particle dose (FPD), fine particle fraction (FPF), respirable fraction (RF), and emitted dose (ED) for inhalable microparticle/nanoparticle formulations all designed and produced at high P (mean ± standard deviation, n = 3)