Figures & data
Table 1 Physicochemical Characterization of SNs, DTPA-SNs and NOTA-SNs Measured by DLS and LDA (Results are Expressed as Mean ± Standard Deviation, n = 3)
Figure 1 (A) Scheme of the one-step method used for the preparation of SNs (left) and the method reproducibility after measuring the hydrodynamic size of 24 independent batches by DLS (right); horizontal bars represent size mean and standard deviation (127 ± 9 nm). (B) Representative Field Emission Scanning Electron Microscopy (FESEM) images of SNs acquired with STEM (top) and InLens (bottom) detectors. (C) Confocal microscopy images showing the internalization of SNs in different cancer cell lines. SNs are labeled in green (TopFluor-SM) and cell nuclei are labeled in blue (Hoechst).
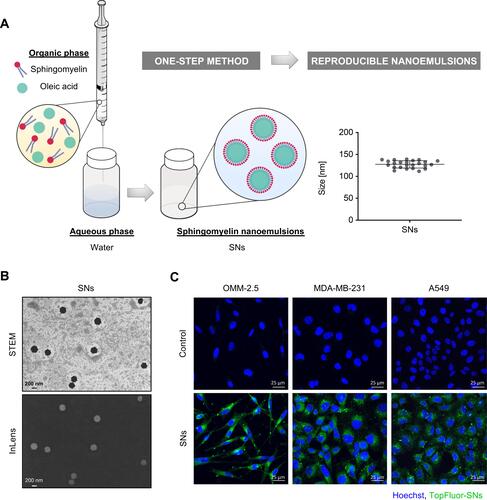
Figure 2 (A) Storage stability of SNs, DTPA-SNs and NOTA-SNs at 4 °C measuring the evolution of the average size by DLS for one month (n=3). (B) Stability in human serum at 37 °C during 72 h measured by DLS (n=3). (C) Radiochemical yield of 68Ga-DTPA-SNs and 68Ga-NOTA-SNs after incubation with the radioisotope for 30 min at 30 °C (n=3). (D) Radiochemical stability of 68Ga-SNs, 68Ga-DTPA-SNs and 68Ga-NOTA-SNs after incubation with serum 4 h at 37 °C (n=3).
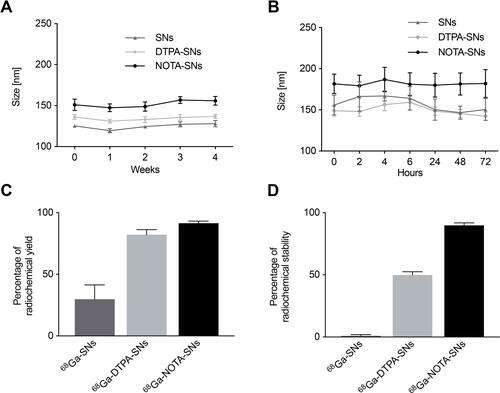
Figure 3 (A) Representative PET/CT whole-body coronal images of 68Ga-DTPA-SNs and 68Ga-NOTA-SNs biodistribution in healthy mice 2 h after intravenous injection (n=5). (B) Ex vivo biodistribution of both radiolabeled nanoemulsions 4 h post-injection (n=5). **(p ≤ 0.01), ***(p ≤ 0.001) was considered statistically significant.
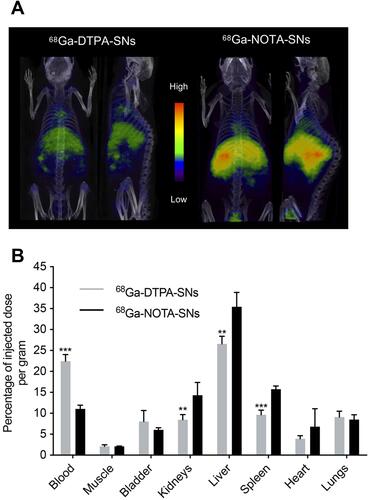
Figure 4 (A) Radiochemical yield of 67Ga-NOTA-SNs (control) and radiochemical stability after incubation with serum 37 °C at different points (0, 24, 48 and 72 h, n=3). (B) Whole-body SPECT images showing the biodistribution of 67Ga-NOTA-SNs compared with free 67Ga during 72 h (n=5).
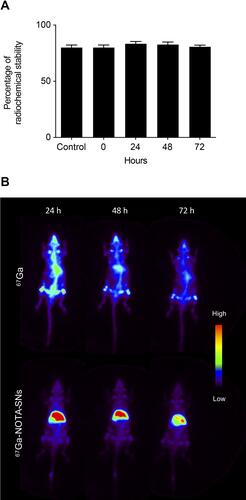
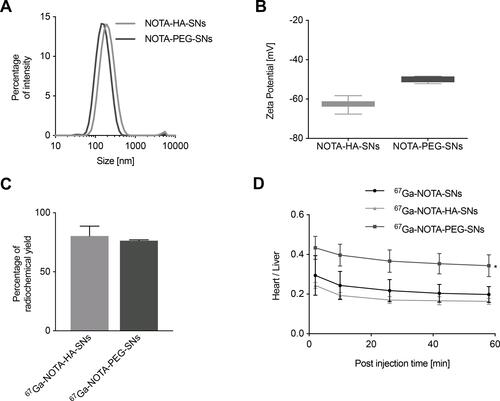
Figure 5 (A) NOTA-HA-SNs and NOTA-PEG-SNs hydrodynamic size distribution measured by DLS (171 ± 5 nm and 138 ± 8 nm, respectively, results are expressed as mean ± standard deviation, n=3), (B) Zeta potential of NOTA-HA-SNs and NOTA-PEG-SNs measured by LDA (− 64 ± 2 mV and − 50 ± 1 mV respectively, results are expressed as mean ± standard deviation, n=3). (C) Radiochemical yield of 67Ga-NOTA-HA-SNs and 67Ga-NOTA-PEG-SNs (n=3). (D) Quantitative analysis expressed as heart to liver ratio showing the differences in biodistribution between intravenously injected 67Ga-nanoemulsions.