Figures & data
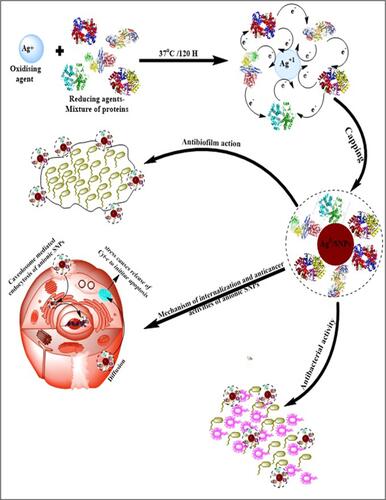
Figure 1 Schematic representation of the mechanism of B. hispica fruit proteins mediated synthesis of biogenic AgNPs and their roles in anticancer, antibacterial, and antibiofilm agents.

Figure 2 Characterization of B. hispida fruit proteins mediated synthesis of AgNPs by physical techniques: (A) UV-visible spectrum, (B) TEM Micrograph with light gray protein Corona mark by an arrow, (C) size distribution by DLS (D) zeta potential (E) surface characterization by FTIR spectrum.
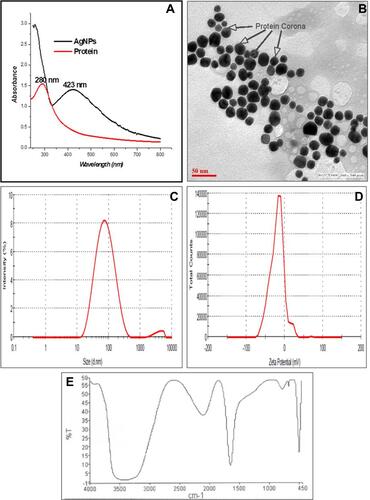
Figure 3 Graph showing the antibacterial potential of silver nanoparticles. All the data were expressed in mean ±SD of three experiments.
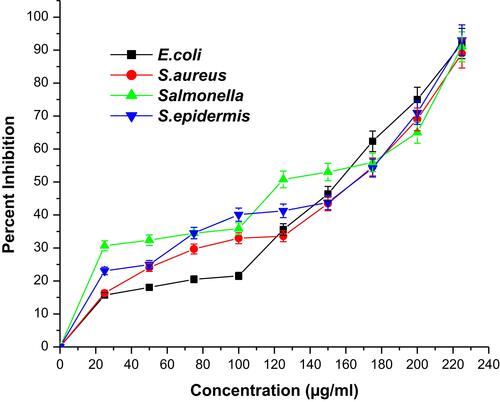
Figure 4 Image and graph showing inhibition of biofilm formation of silver nanoparticles. All the data were expressed in the mean ±SD of three experiments.
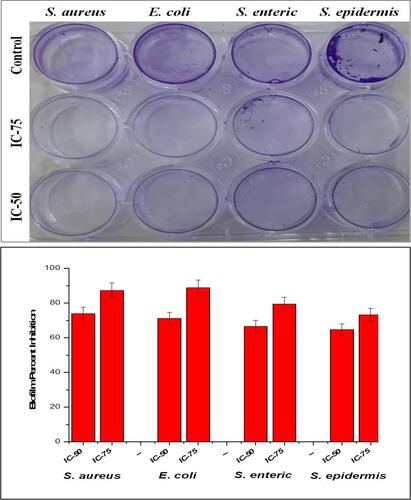
Figure 5 The cytotoxicity study graph of MTT assay for AgNPs treatment against (A) A549 cells and (B) NRK cells.
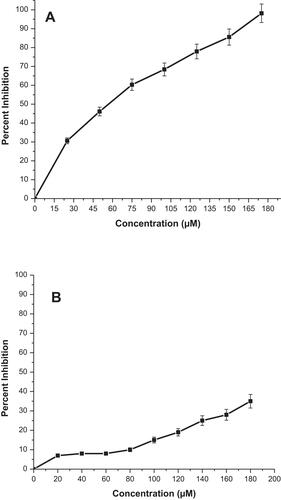
Figure 6 The cytomorphological study of AgNPs treated A549 cells (A) control, (B) IC25 (C) IC50, (D) IC75 at 20× magnification.
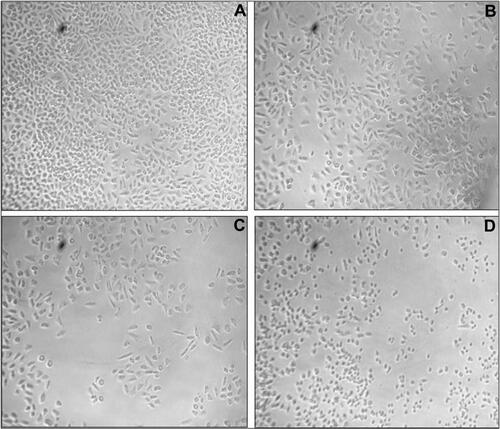
Figure 7 Images observed for AgNPs treated cells under phase contrast microscope after 48 hrs of treatment for DAPI staining (A) control (B) treated cells; for Mito Tracker Red staining (C) control (D) treated cells and for DCFDA staining (E) control (F) treated cells.
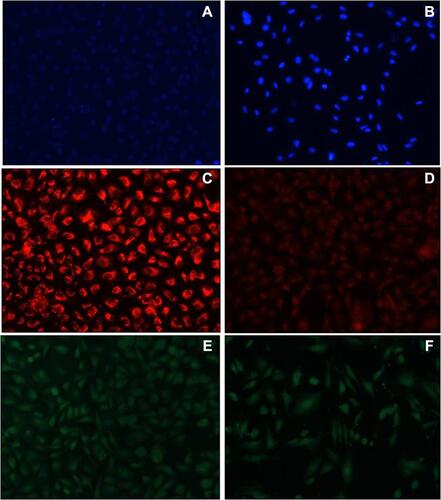
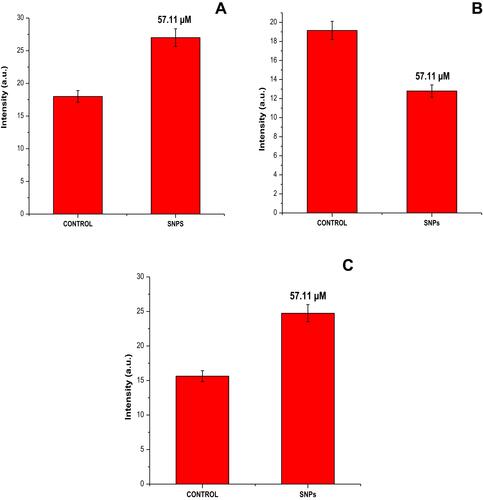
Figure 8 Graphical representation in terms of percent (A) nuclear condensation, (B) mitochondrial content, and (C) intracellular ROS generation. All the data were expressed in the mean ±SD of three experiments.