Figures & data
Figure 1 The flow chart of pHsp70-Egr1-HSVTK construction.
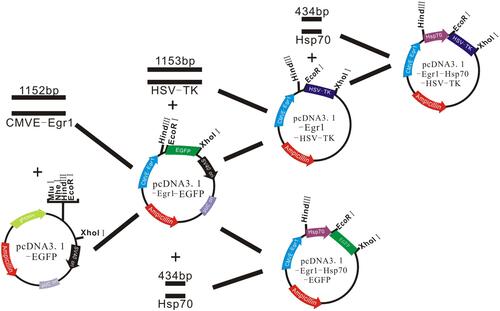
Figure 2 (A) HREM image of Mn0.5 Zn0.5Fe2O4. (B) SEM-EDS analysis of Mn0.5 Zn0.5Fe2O4. (C) XRD analysis of Mn0.5 Zn0.5Fe2O4. (D) TEM image of the PEI-Mn0.5 Zn0.5Fe2O4. (E) FTIR of PEI- Mn0.5 Zn0.5Fe2O4 and Mn0.5 Zn0.5Fe2O4. (F) Adsorption of PEI on the surface of nanoparticles under different pH. (G) Scheme of PEI/MZF interaction with DNA.
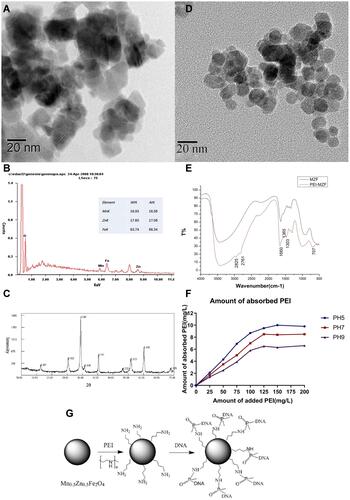
Table 1 PEI-Mn0.5Zn0.5Fe2O4 Nanoparticle Toxicity Test MTT (, n=8)
Table 2 PEI/DNA Toxicity Test MTT (, n = 8)
Figure 3 Comparison of PEI-MZF and PEI cytotoxicity under different N/P ratio The N/P ratio of PEI/MZF/DNA and PEI/DNA was 1, 3, 5, 7, 9, 11.
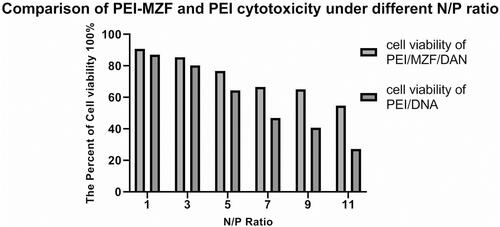
Table 3 Hemolysis Test Results
Table 4 Results of Acute Toxicity Test of Nanoparticles
Table 5 Micronucleus Test Results
Figure 4 Thermodynamic test of different concentration of PEI- Mn0.5 Zn0.5Fe2O4in vitro.
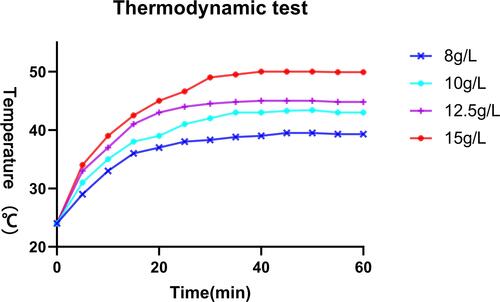
Figure 5 Image of agarose gel electro-phoresis of plasmid DNA and complexed with PEI- Mn0.5 Zn0.5Fe2O4 (Lane1-5(PEI-MZF/DNA w/w): 0:1; 5:1; 10:1; 20:1; 30:1).
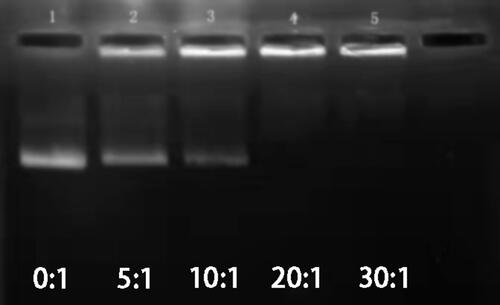
Figure 6 (A) PCR gel electrophoresis of Egr1-HSVTK transfected (lane 1: Marker IV (each band in turn from top to bottom is 7 K, 5.5 K, 3.5 K, 2 K, 1 K, 500 bp); lane 1: Egr1-HSVTK). (B) Sequencing and alignment of Egr1-HSVTK (sequence 0: HSVTK; sequence 1:Egr1-HSVTK-Egr1-f.ab1; software: Dnassit 2.0).
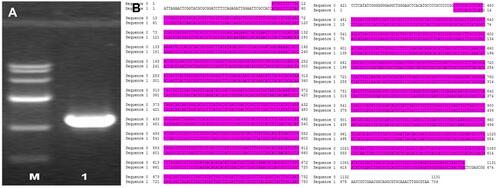
Figure 7 (A) PCR gel electrophoresis of Hsp70-Egr1-EGFP transfected (lane 1: Marker IV each band in turn from top to bottom is 7 K, 5.5 K, 3.5 K, 2 K, 1 K, 500 bp); lane 1–4: Hsp70-Egr1-EGFP①-④). (B) Sequencing and alignment of Hsp70-Egr1-EGFP (sequence 0: HSP70; sequence 1: Hsp70-Egr1-EGFP-f.ab1; software: Dnassit 2.0).
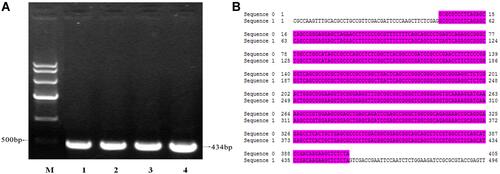
Figure 8 (A) Egr1-Hsp70- HSVTK was identified by EcoRI and HindIII dual restriction enzyme digestion (lane 1: Marker IV each band in turn from top to bottom is 7 K, 5.5 K, 3.5 K, 2 K, 1 K, 500 bp;lane 1–3: pCDNA3.1-Egr1- Hsp70-HSVTK①-③digested by EcoRI and HindIII.). (B) Egr1- Hsp70-HSVTK was identified by MluI restriction enzyme digestion (lane 1: Marker IV each band in turn from top to bottom is 7 K, 5.5 K, 3.5 K, 2 K, 1 K, 500 bp;lane 1–2: Hsp70-Egr1- HSVTK ①-②digested by MluI.).
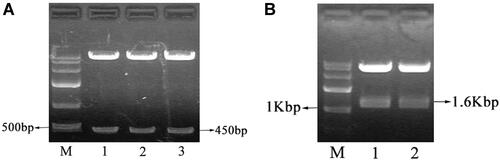
Figure 9 TK expression induced by radiation at different time point. Compared the TK expression at 48h with that in other groups, P < 0.05. Compared the TK expression at 6h with that at other time point, P < 0.05.
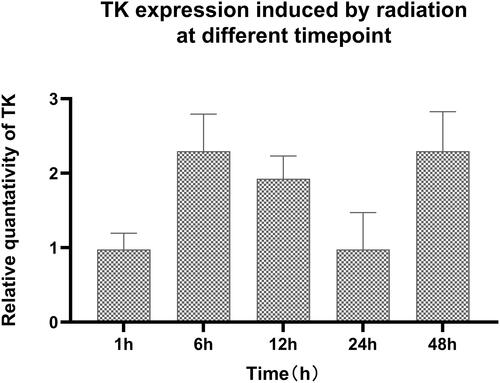
Figure 10 TK expression induced by different dose of radiation. Compared the TK expression with 0Gy radiation with that in other groups P < 0.05. Compared the TK expression after 2Gy radiation with that in other groups P < 0.05.
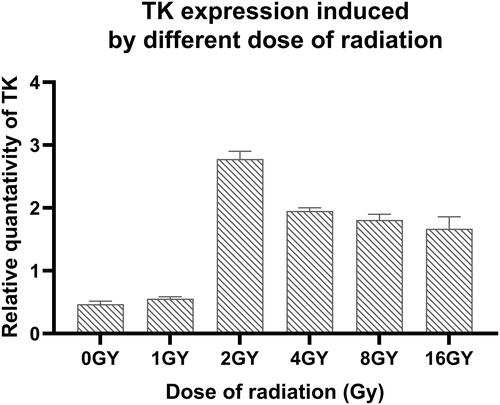
Figure 11 TK expression induced by different methods. Compared the TK expression without treatment, with that in other groups P < 0.05. Compared the TK expression with radiation and thermo, with that in other groups P < 0.05.
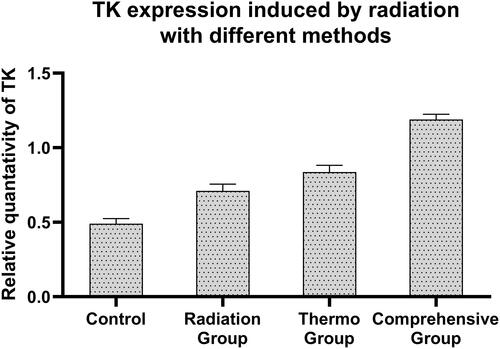
Figure 12 Expression of HSV-TK in SMC7721cells induced by different methods. 1 100bp Marker. 2 Negative control (not transfected). 3 Radiation group (not transfected). 4 Hyperthermia group (not transfected). 5 TK transfection by radiation induction group. 6 TK transfection by heat induction group. 7 TK transfection by radiation and heat shock induction group.
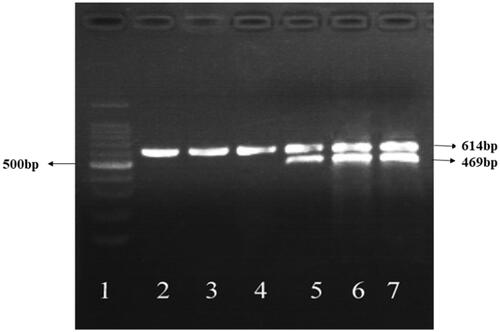
Table 6 The Cell Viability of SMMC-7721 cells After Treatment (, n = 6)
Figure 13 The cell viability of SMC7721 cells after treatment.
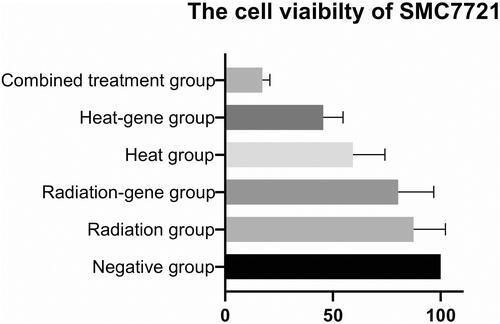
Table 7 Flow Cytometry of Cell Cycles and Apoptosis
Figure 14 (A) Cell cycle results of SMMC7721 cells after treatment. (B) Flow cytometry results of SMMC7721 cells after treatment.
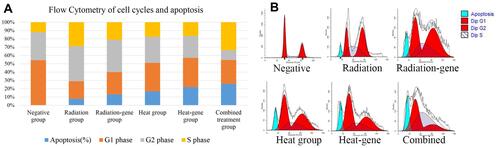
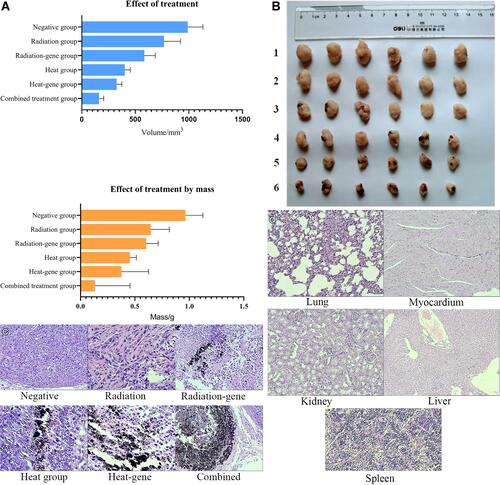
Figure 15 (A) Inhibitory rate of weight and mass in xenograft tumor after treatment. (B) Tumor morphological appearance after treatment. 1 Negative group. 2 Radiation group. 3 Radiation-gene group. 4 Mn0.5Zn0.5Fe2O4 hyperthermia group. 5 Heat-gene group. 6 The combined group. (C) The histo-morphology of tumors after treatment (100×). Negative group: The cells are tightly arranged, with rich cytoplasm, large and deeply stained nucleus, and active proliferation. Combined group: The cells are obviously necrotic, and magnetic material deposition can be seen between the tissue. (D) The histo-morphology of organs after treatment (100×). A lung B heart C kidney D liver E spleen.