
Figures & data
Figure 1 Timeline of SCPs for PDT.
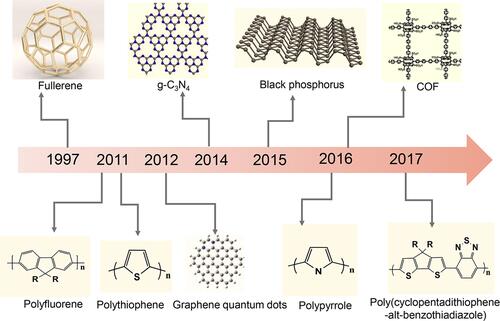
Figure 2 (A) Schematic illustration of SCPs photophysical and photochemical basis of PDT. (B) Reduction potential diagram of reactive oxygen species.
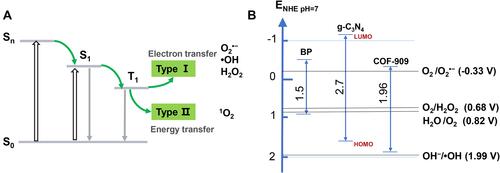
Table 1 Bandgap of SCPs
Figure 3 Chemical structures of SCPs for PDT (electron acceptors are shown in blue; electron donors are shown in red).
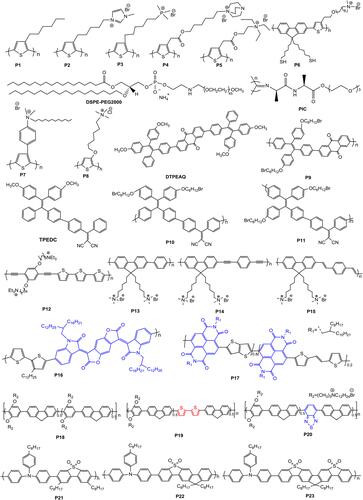
Figure 4 Chemical structures and singlet and triplet energy levels of three model compounds.
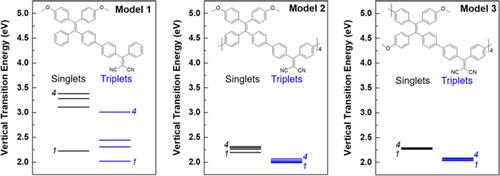
Figure 5 Chemical structures of SCPs (electron acceptors are shown in blue; electron donors are shown in red).
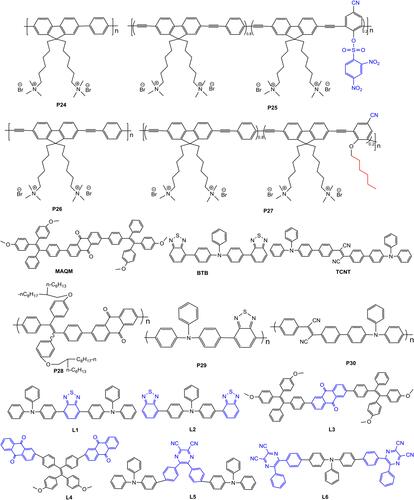
Figure 6 Chemical structures of SCPs for PDT.
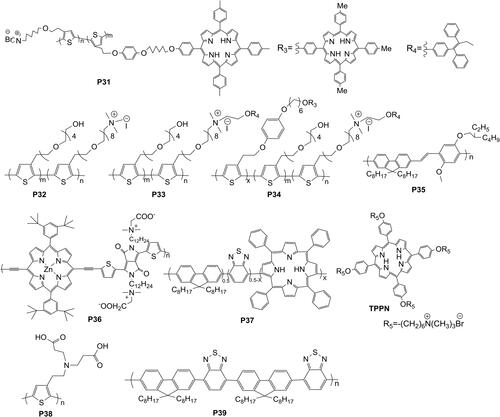
Figure 7 Chemical structures of SCPs.
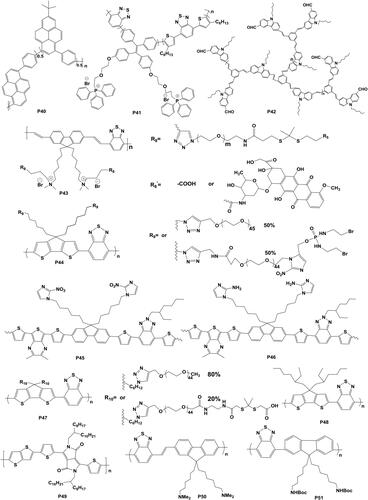
Figure 8 (A) Schematic illustration of P44 for hypoxia-activated synergistic PDT and chemotherapy. Reproduced from: Cui D, Huang J, Zhen X, Li J, Jiang Y, Pu K. A semiconducting polymer nano-prodrug for hypoxia-activated photodynamic cancer therapy. Angew Chem Int. 2019;58(18):5920–5924.Citation76 Copyright © 2019 Wiley‐VCH Verlag GmbH & Co. KGaA, Weinheim. (B) Schematic illustration of the self-regulated photodynamic properties of P48 at physiologically neutral, pathologically acid conditions and comparison between self-regulated and conventional. Reproduced with permission from: Zhu H, Fang Y, Miao Q, et al. Regulating near-infrared photodynamic properties of semiconducting polymer nanotheranostics for optimized cancer therapy. ACS Nano. 2017;11(9):8998–9009.Citation79 Copyright © 2017, American Chemical Society.
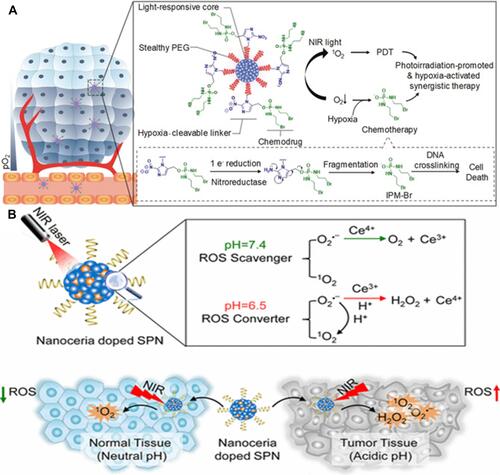
Figure 9 The scheme for synthesis of COP-P-SO3H.
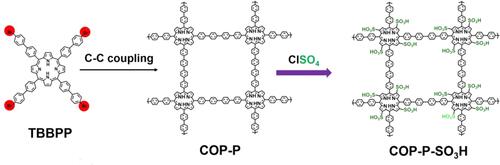
Figure 10 Syntheses of precursors and COFs (precursors of connection unit are shown in blue).
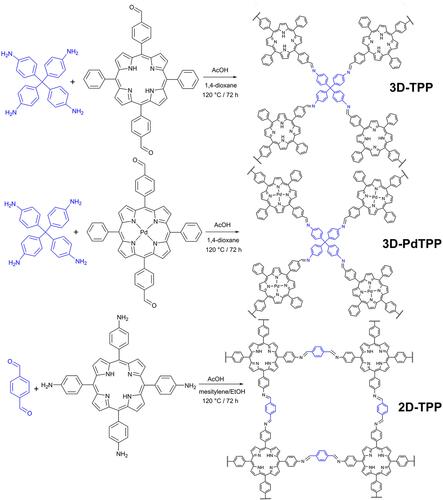
Table 2 Summary of Oxygen-Generating Strategies for Tumor Oxygenation
Table 3 Summary of Light Penetration Strategies