Figures & data
Scheme 1 Schematic illustration of the mechanism of Au@Cu-Sb-S nanoparticles (NPs) in the diagnosis and treatment of breast cancer.
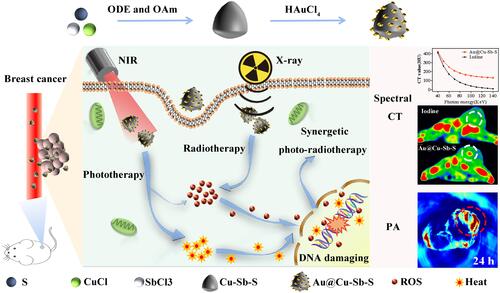
Figure 1 Characterization of Au@Cu-Sb-S nanoparticles (NPs) with different gold-to-copper ratios. (A) TEM-EDS elemental maps of Au@Cu-Sb-S NPs. (B) Transmission electron microscopy (TEM) image of Au@Cu-Sb-S(4–1) NPs. (C) Particle size distribution of Au@Cu-Sb-S(4–1) NPs. (D) Compositional analysis of Au@Cu-Sb-S NPs obtained from TEM-energy-dispersive X-ray spectroscopy (EDS). (E) XRD spectra of Au@Cu-Sb-S NPs. (F) Mass extinction coefficient of Au@Cu-Sb-S(1–4) NPs and Au@Cu-Sb-S(4–1) NPs under an 808 nm laser. (G) UV-vis-NIR absorbance spectrum of Cu-Sb-S NPs, Au@Cu-Sb-S(1–4) NPs and Au@Cu-Sb-S(4–1) NPs with the same Sb concentration (100 Sb ppm). (H) Heating curves of pure and different NPs (Cu-Sb-S NPs, Au@Cu-Sb-S(1–4) NPs and Au@Cu-Sb-S(4–1) NPs) with the same 100 ppm Sb concentration.
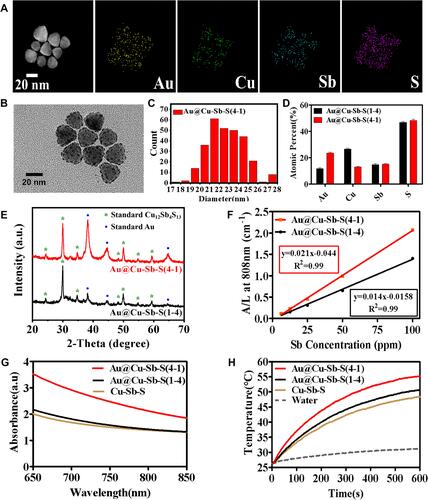
Figure 2 In vitro assessment of the therapeutic efficacy of Au@Cu-Sb-S nanoparticles (NPs). (A) Relative viability of 4T1 cells exposed to different treatments at increased Sb concentrations. (Significant differences are represented as ***p < 0.001.) (B) Clonogenic survival assay of 4T1 cells incubated with PBS or Au@Cu-Sb-S NPs (25 Sb ppm) and treated with X-rays at various doses. (C) Fluorescence images of 4T1 cells stained with DCFH-DA. (D) Fluorescence images of 4T1 cells stained with calcein-AM and PI after each treatment. (E) Cell apoptosis effects in 4T1 cells subjected to with different treatments after incubation with PBS or Au@Cu-Sb-S NPs (25 Sb ppm).
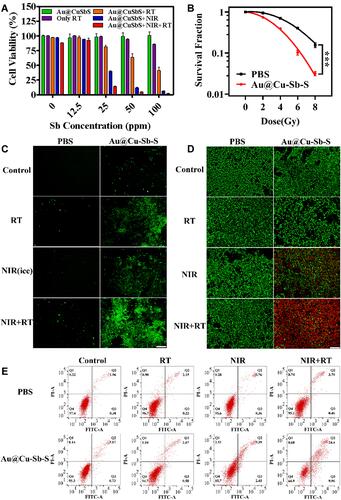
Figure 3 Spectral computed tomography (CT) and photoacoustic (PA) imaging of Au@Cu-Sb-S nanoparticles (NPs) in vitro and in vivo. (A) CT brightness and intensity values of Au@Cu-Sb-S NPs and Iodine at different concentrations under the 60 KeV condition. (B) CT values of Au@Cu-Sb-S NPs and Iodine with KeV changes under 5.5mg mL−1 Au/I concentration. (C) In vivo spectral CT images of tumor-bearing mice before and after intra-tumoral injection of equivalent concentrations of Au @ Cu-Sb-S NPs and Iodine (5.5 mg mL−1 Au/I, 25 μL) at 60, 100, and 140 KeV. (D) Linear correlation between average PA signal intensity and Au@Cu-Sb-S NPs aqueous dispersion at different Sb concentrations. (E) In vivo PA imaging of 4T1 tumor-bearing mice before and after injection of Au@Cu-Sb-S NPs.
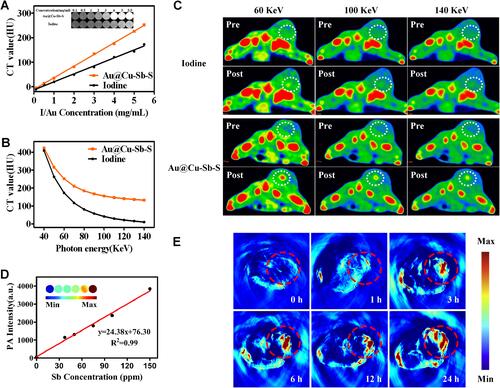
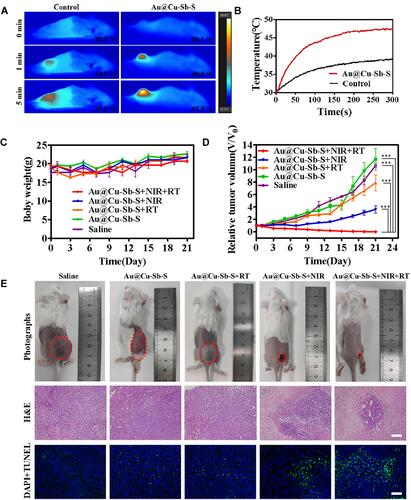
Figure 4 Therapeutic effect of Au@Cu-Sb-S nanoparticles (NPs) in vivo. (A) Infrared thermal images and (B) temperature changes of BALB/c mice bearing 4T1 tumors after injection of saline (left) or Au@Cu-Sb-S NPs (right), followed by irradiation with a continuous NIR laser. (C) Time-dependent body weight and (D) tumor growth curves of 4T1 tumor-bearing nude mice from each group. The statistical differences were assessed using one-way ANOVA (***p < 0.001). (E) Digital photographs of mice on day 21 after various treatments, H&E staining and TUNEL staining of tumors are shown.