Figures & data
Figure 1 (A) Schematic illustration of the preparation of PCL/Gel blend membrane loaded polaprezinc; (B) scanning electron microscopy (SEM) images of various PZ-loaded nanofibers; (C) the average diameters of different nanofibers. Error bars represent mean ± SD, **p < 0.01.
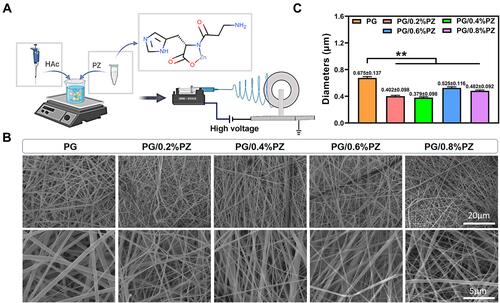
Figure 2 (A) The Fourier-transform infrared spectroscopy (FTIR) spectra of different nanofibers and pure PZ; (B) the water contact angle of different nanofibers obtained at 0, 5, and 10 s, respectively. *p < 0.05.
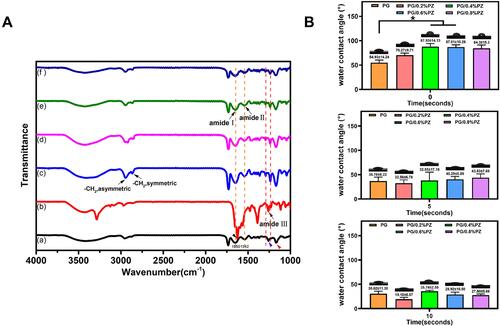
Figure 3 (A) Scanning electron microscopy (SEM) images of PG and PG/0.4%PZ samples after immersion for 1, 4, 7, 14, 21 d; (B) the weight loss of PG and PG/0.4%PZ after degradation for different time; (C) the cumulative release of PZ from PG/0.4%PZ specimens. Error bars represent mean ± SD, *p < 0.05.
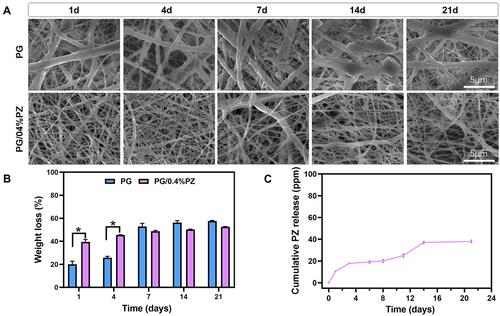
Figure 4 The cell viability of MC3T3-E1 cells on different nanofibers after incubation for 4 and 7 d under normal and oxidative conditions. *p < 0.05, **p < 0.01.
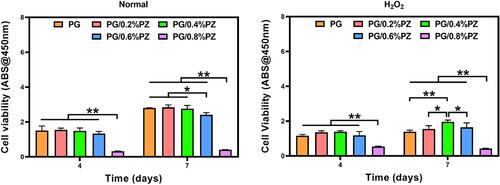
Figure 5 (A) Alkaline phosphatase (ALP) staining images of MC3T3-E1 cells after incubation for 7 d; (B) quantitative analysis of ALP activity under normal conditions; and (C) quantitative analysis of ALP activity under oxidative conditions. Error bars represent mean ± SD, *p < 0.05, **p < 0.01.
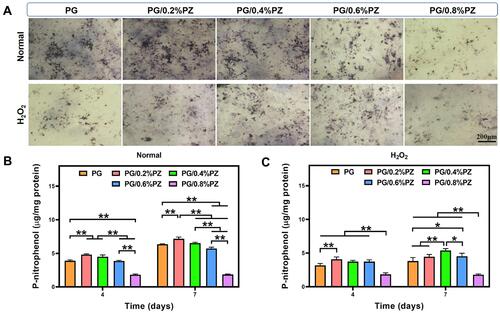
Figure 6 (A) Alizarin staining images of MC3T3-E1 cells after incubation for 14 d; (B) quantitative analysis of mineralization under normal conditions; and (C) quantitative analysis of mineralization under oxidative conditions. Error bars represent mean ± SD, *p < 0.05, **p < 0.01.
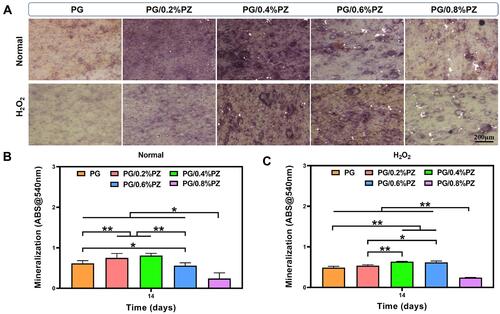
Figure 7 (A) Representative Western blotting images of HO-1/Nrf2/SOD1in different groups (1 - PG, 2 - PG/0.2%PZ, 3 - PG/0.4%PZ, 4 - PG/0.6%PZ, 5 - PG/0.8%PZ); quantitative statistics of Nrf2/β-actin (B), HO-1/β-actin (C), and SOD1/β-actin (D), respectively. Error bars represent mean ± SD, *p < 0.05.
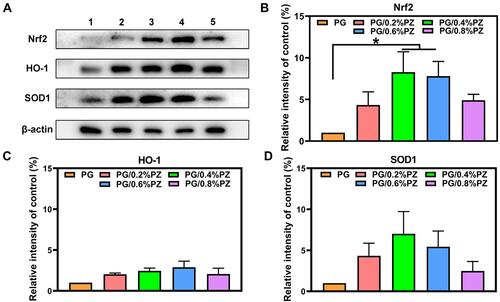
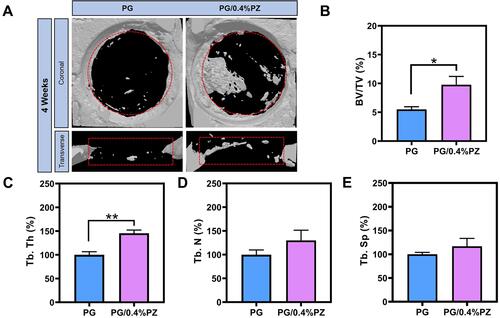
Figure 8 (A) Typical micro-CT images of the cranial bone defect area marked with dotted circle/rectangle after 4 weeks; quantitative statistics of bone volume/total volume (BV/TV, (B)), trabecular thickness (Tb.Th, (C)), trabecular number (Tb.N, (D)), and trabecular separation (Tb.Sp, (E)). Error bars represent mean ± SD, *p < 0.05, **p < 0.01.