Figures & data
Table 1 Optimization Parameters for Preparation of Fasudil Phospholipid Complex (Data are Presented as Mean ± SD, n = 3)
Figure 1 (A) FT-IR spectra and (B) XRD patterns of Fas, PL, physical mixture and Fas/PL complex.
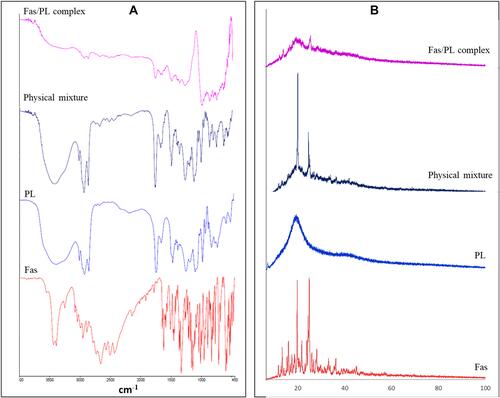
Table 2 Physicochemical Characterization of Different Batches of B-Lipodisp Prepared by Methanol Injection Method (Data are Presented as Mean ± SD, n = 3)
Figure 2 TEM images of liposomal formulations at magnification x25,000. Scale bars represent 200 nm.
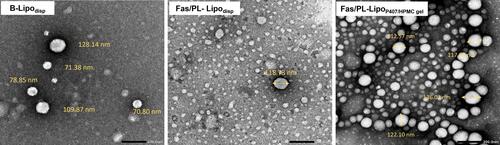
Table 3 Gelling Properties and Viscosity Data of P407 in situ Gels and P407/HPMC in situ Gels (Data are Presented as Mean ± SD, n = 3)
Figure 3 (A) Rheogram and (B) Thixotropic behavior of in situ gel formulations at physiological temperature.
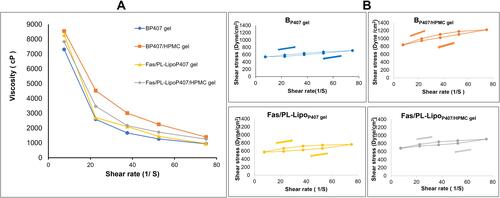
Table 4 Storage Stability Data at 4°C of Fas/PL-Lipodisp and Fas/PL-LipoP407/HPMC gel (Data are Presented as Mean ± SD, n = 3)
Figure 4 Release profiles of tested formulations over a 24 h period in STF pH 7.4 at 50 rpm and 35 °C (n=3).
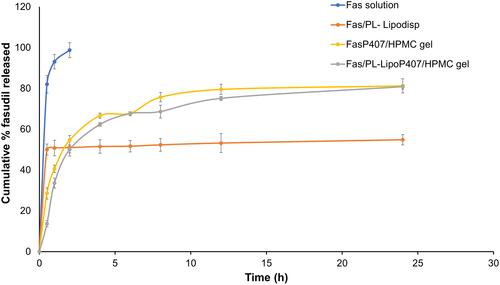
Figure 5 (A) Viscosity values of mucin dispersion in water (20% w/v), formulations, theoretical sum of formulation and mucin viscosities and the viscosity of formulation/mucin 2:1 mixtures (B) Rheological synergism of the four tested formulations upon mixing with mucin at a 2:1 ratio represented by Δη % (mean ± SD, n=3).
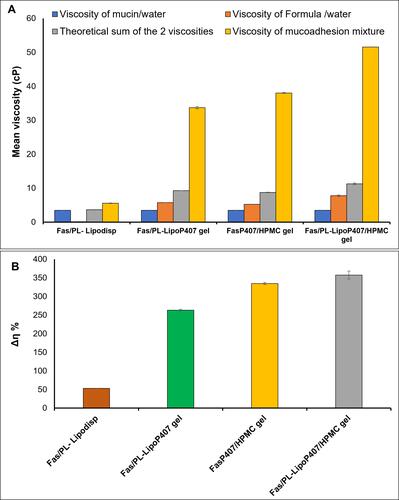
Table 5 Ex vivo Corneal Permeation Flux* Values
Figure 6 (A) Ex vivo corneal permeation profile of fasudil from Fas/PL-Lipodisp, FasP407/HPMC gel and Fas/PL-LipoP407/HPMC gel compared to Fas solution (mean ± SD, n=3) (B) Ex vivo corneal permeation flux values.
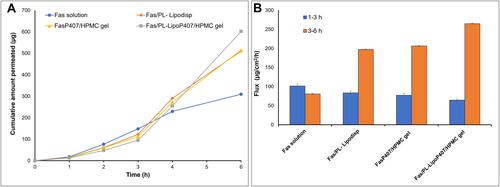
Figure 7 (A) Photographs of hen’s egg test-chorioallantoic membrane (HET-CAM) after treatment at room temperature to predict ophthalmic irritation potential and (B) Average grey value of pixels of test formulations analyzed using Image J software as an indicator of ocular irritation (n=4).
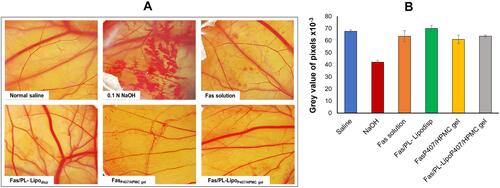
Figure 8 Percentage decrease in IOP after ocular application of 0.5% Fas solution, Fas/PL-Lipodisp, FasP407/HPMC gel and Fas/PL-LipoP407/HPMC gel. Data expressed as mean ± SD (n = 3).
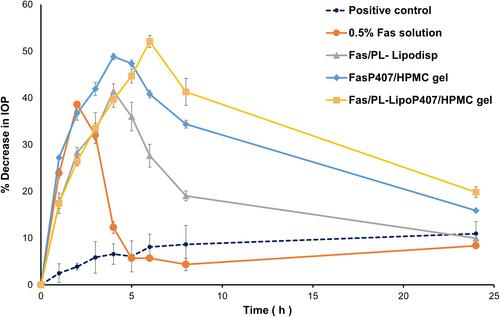
Table 6 Pharmacodynamic Parameters of Fas Solution, Fas/PL-Lipodisp, FasP407/HPMC Gel and Fas/PL-LipoP407/HPMC gel
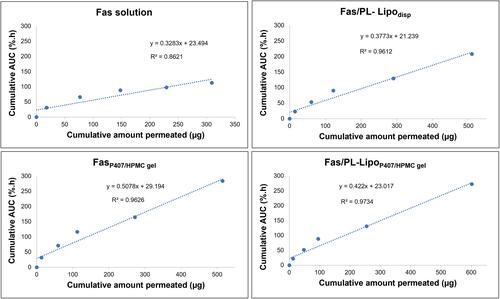
Figure 9 Correlation between ex vivo cumulative amount permeated () and in vivo cumulative area under the pharmacodynamic curve () at corresponding times over 24 h.