Figures & data
Figure 1 The overall strategy and mechanism of DXMS/CAP@PLGA-ILs targeting MCs. (A) The novel functionalized NPs (DXMS/CAP@PLGA-ILs) were constructed in this study. (B) DXMS/CAP@PLGA-ILs in blood circulation enter the glomerulus. The NPs between 70–130 nm can penetrate the glomerular endothelial space (70–130 nm) into the glomerular MCs area, but cannot penetrate the glomerular basement membrane (10–70 nm) and passively target to the region of glomerular MCs. (C) The mechanism of “anti-inflammation/anti-fibrosis”for GN after DXMS/CAP@PLGA-ILs MCs. “①” DXMS/CAP@PLGA-ILs enters cells through receptor-mediated endocytosis; “②” Lipid bilayer releases CAP through membrane fusion, Inhibits the production of TGF-β, and exerts anti-fibrosis effect; “③” DXMS molecules are released into the cytoplasm and enter the nucleus to exert anti-inflammatory effects.
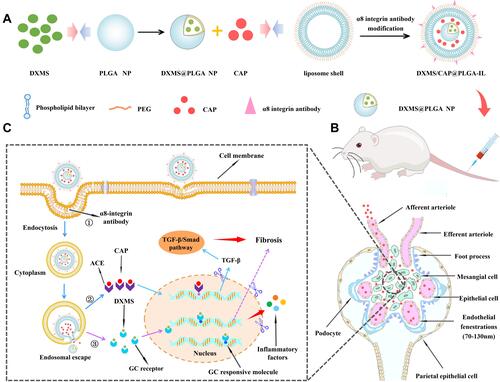
Table 1 Physicochemical Properties of the Prepared NPs
Figure 2 The characterization of nanocarriers and in vitro release of DXMS/CAP@PLGA-ILs. (A) TEM of PLGA NPs (Scale bars: 100 nm). (B) TEM of PLGA-LNHys (Scale bars: 100 nm). (C) TEM of PLGA-ILs (Scale bars: 100 nm). (D) In vitro DXMS and CAP cumulative release profiles under PBS. Data were expressed as mean ± SD (n = 3).
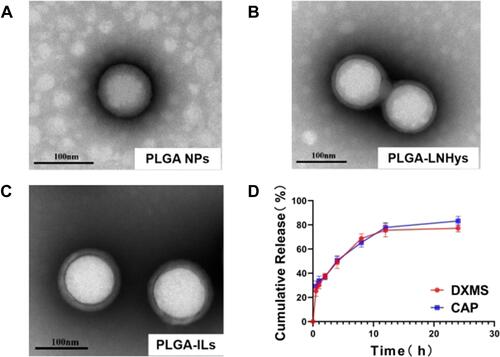
Figure 3 Cell studies of PLGA-ILs in vitro. (A) Cytotoxicity results of PLGA NPs, PLGA-LNHys and PLGA-ILs at PLGA concentrations ranging from 0.125 to 2 mg/mL. (B) Immunofluorescence detection of MCs surface protein α8-integrin (×400). (C) Cellular uptake of PLGA NPs, PLGA-LNHys and PLGA-ILs in vitro. Blue, green and red represent DAPI, C6 and RHOD fluorescence, respectively. Scale bars: 50 μm. (D) Relative fluorescence density of PLGA NPs, PLGA-LNHys and PLGA-ILs uptake by MCs. (E) Distribution of NPs in the kidney, “→” represents mesangial region. Blue, green and red represent DAPI, C6 and RHOD fluorescence, respectively. Scale bars: 25 μm. All data were measured as mean ± S.D, ** = P < 0.01, *** = P < 0.001, n=3. Statistical significance was determined by one-way ANOVA with Tukey post hoc test.
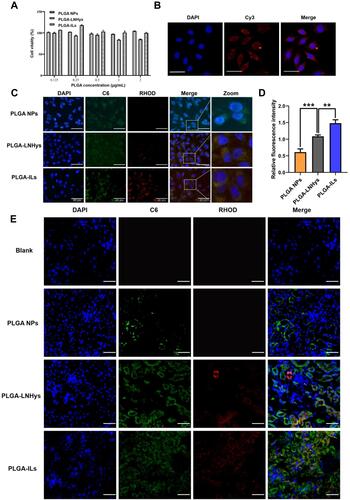
Figure 4 (A) In vivo bioluminescence images of mice receiving saline, free Cy5.5, Cy5.5@PLGA NPs, Cy5.5@PLGA-LNHys, or Cy5.5@PLGA-ILs at different time point. (B) Ex vivo imaging of organs in mice at different time point. (C) Mean fluorescence intensity of kidney at different time points ex vivo imaging. All data were measured as mean ± S.D, * = P < 0.05, ** = P < 0.01, *** = P < 0.001, n=3. Statistical significance was determined by one-way ANOVA with Tukey post hoc test.
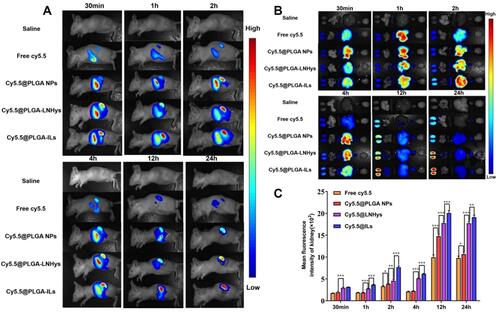
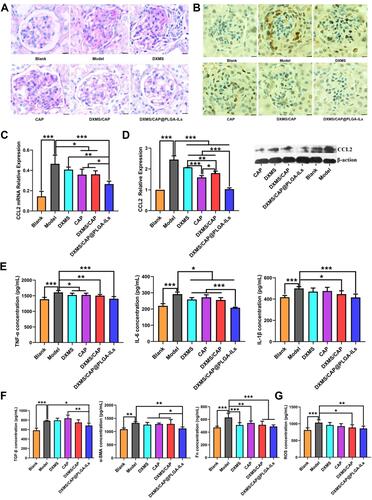
Figure 5 DXMS/CAP@PLGA-ILs supressed glomerular inflammation and fibrosis. (A) Glomerular histology revealed by PAS staining of kidney tissue sections. The pathological change was rescued by various degrees with different treatments. Scale bars, 25 μm. (B) Immunohistochemical staining of PCNA in kidney tissue sections. DXMS/CAP@PLGA-ILs displayed strong therapeutic effects. Scale bars, 25 μm. (C) Real-time PCR kidney inflammatory chemokines CCL2 test results. (D) Western blot inflammatory chemokines CCL2 protein expression test results. (E) Inflammatory factor (TNF-α, IL-6, and IL-1β) levels in renal cortical tissues. (F) Fibrosis factor (TGF-β, α-SMA and Fn) levels in renal cortical tissues. (G) The expression levels of ROS in renal cortical tissues. All data were measured as mean ± S.D, * = P < 0.05, ** = P < 0.01, *** = P < 0.001. Statistical significance was determined by one-way ANOVA with Tukey post hoc test.