Figures & data
Figure 1 Fabrication of m-HANFs/GelMA hydrogels for the advancement of osteogenic differentiation of MC3T3 cells in vitro and bone formation in vivo.
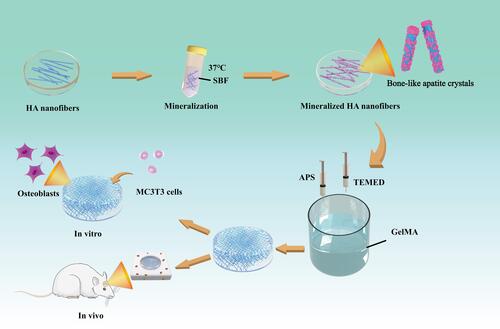
Table 1 Sample of m-HANFs/GelMA
Figure 2 SEM images of HANFs that were mineralized for 0 d (A1 and A2), 3 d (B1 and B2) and 5 d (C1 and C2).
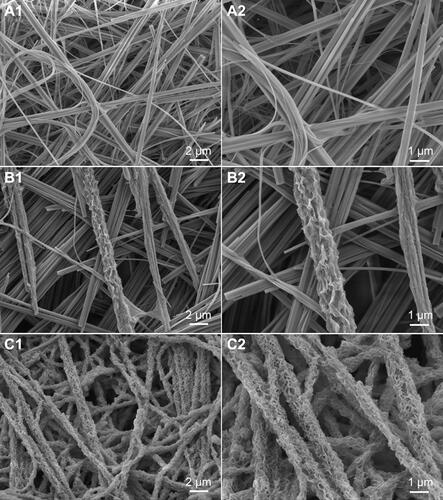
Figure 3 SEM images of 0m-HANFs/GelMA (A1 and A2), 5m-HANFs/GelMA (B1 and B2), 15m-HANFs/GelMA (C1 and C2) and 25m-HANFs/GelMA (D1 and D2) composite hydrogels.
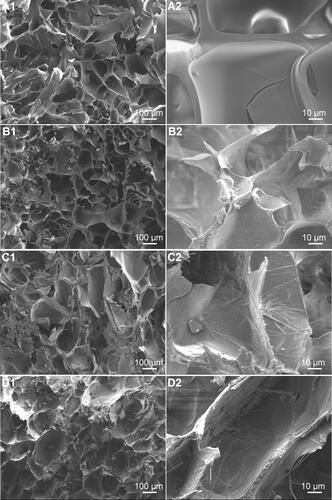
Figure 4 XRD patterns of HANFs, m-HANFs, and m-HANFs/GelMA with different weight fractions of m-HANFs.
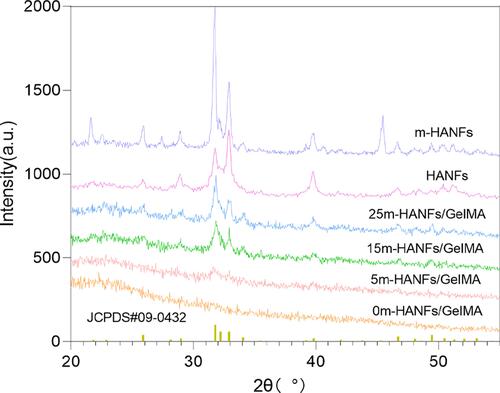
Figure 5 Mechanical properties of m-HANFs/GelMA hydrogels with different weight fractions of m-HANFs. (A) Stress-strain curves; (B) Strain at failure; (C) Ultimate tensile strength; (D) Young’s modulus. Data are presented as the mean ± SD (n = 6). ****p < 0.0001 compared with the 0m-HANFs/GelMA hydrogel. ####p < 0.0001.
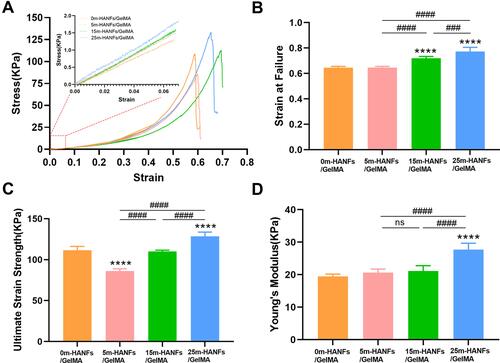
Figure 6 (A) Swelling properties and (B) degradation performance of m-HANFs/GelMA hydrogels with different weight fractions of m-HANFs vs time. Data are presented as the mean ± SD (n = 6). *p < 0.05; **p < 0.01; ****p<0.0001 compared with the 0m-HANFs/GelMA hydrogel. #p < 0.05.
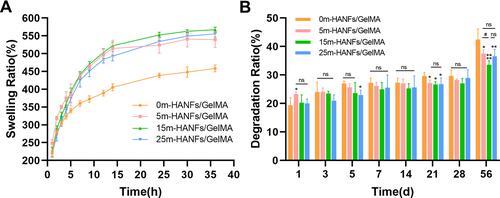
Figure 7 Biocompatibility of the m-HANFs/GelMA hydrogels. (A) Proliferation of MC3T3 cells cocultured with the extracts of m-HANFs/GelMA hydrogels for different time. (B) Live/dead cell staining of m-HANFs/GelMA hydrogels with different weight fractions of m-HANFs. Live cells were stained green and dead cells were stained red after 3 days of culture on the hydrogels. (C) SEM images of MC3T3 cells on composite hydrogels with different weight fractions of m-HANFs after 3 days of culture. Data are presented as the mean ± SD (n = 3).
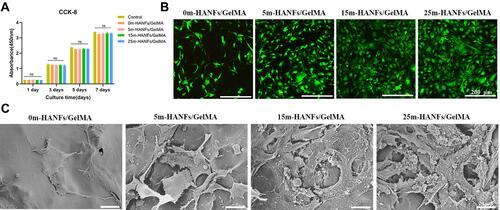
Figure 8 (A) ALP and (B) alizarin red staining images of MC3T3 cells cultured on m-HANFs/GelMA hydrogels with different m-HANF contents for 7 and 21 days, respectively. (C) Quantification of alizarin red staining. Data are presented as the mean ± SD (n = 3). *p < 0.05; ***p < 0.001; ****p < 0.0001 compared with the 0m-HANFs/GelMA hydrogel. #p < 0.05; ##p < 0.01; ####p < 0.0001.
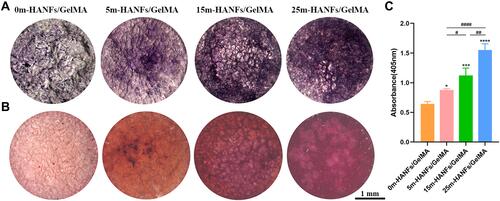
Figure 9 (A) Schematic diagram of a calvarial defect. (B) Top view of the micro-CT 3D reconstruction of the calvarial defect. (C) Measurement of the bone volume/total volume ratio (BV/TV), trabecular number (Tb.N) and trabecular thickness (Tb.Th). Data are presented as the mean ± SD (n = 3). *p < 0.05; **p < 0.01; ***p < 0.001; ****p < 0.0001 compared with the control hydrogel. #p < 0.05; ##p < 0.01; ###p < 0.001; ####p < 0.0001 compared with the 0m-HANFs/GelMA hydrogel. Δ< 0.05; ΔΔp < 0.01; ΔΔΔp < 0.001.
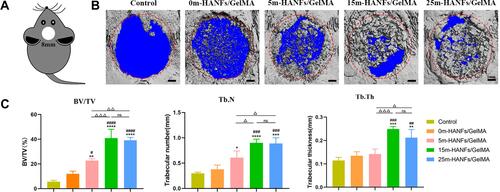
Figure 10 H&E staining of decalcified sections. a) The middle part of the defect in the control group. b) The margin of the defect in the control group. c) The middle part of the defect in the 0m-HANFs/GelMA group. d) The margin of the defect in the 0m-HANFs/GelMA group. e) The middle part of the defect in the 5m-HANFs/GelMA group. f) The margin of the defect in the 5m-HANFs/GelMA group. g) The middle part of the defect in the 15m-HANFs/GelMA group. h) The margin of the defect in the 15m-HANFs/GelMA group. i) The middle part of the defect in the 25m-HANFs/GelMA group. j) The margin of the defect in the 25m-HANFs/GelMA group. New blood vessels are marked by yellow arrows. Masson’s trichrome staining of decalcified sections. k) The middle part of the defect in the control group. l) The margin of the defect in the control group. m) The middle part of the defect in the 0m-HANFs/GelMA group. n) The margin of the defect in the 0m-HANFs/GelMA group. o) The middle part of the defect in the 5m-HANFs/GelMA group. p) The margin of the defect in the 5m-HANFs/GelMA group. q) The middle part of the defect in the 15m-HANFs/GelMA group. r) The margin of the defect in the 15m-HANFs/GelMA group. s) The middle part of the defect in the 25m-HANFs/GelMA group. t) The margin of the defect in the 25m-HANFs/GelMA group. Scale bar: green: 1 mm, yellow: 100 μm.
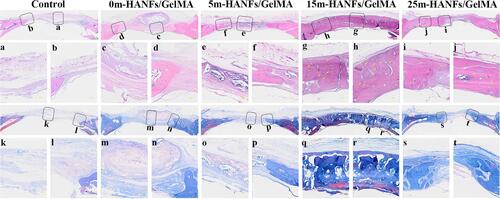
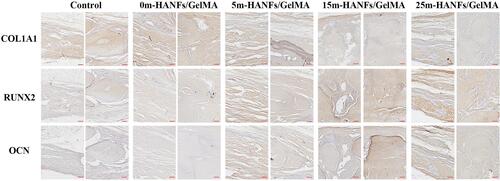
Figure 11 Immunohistochemical staining of Runx2, Col1a1, and OCN (brown). Scale bar: 50 μm.