Figures & data
Table 1 Formulae Key, Composition, and Formulation Variables of PLGA NSs Unloaded/Loaded with GPS
Table 2 1H NMR (DMSO-D6, 500 MHz) and 13C NMR (DMSO-D6, 125 MHz) for GPS Compound
Figure 1 Structure of gentiopicroside (GPS).
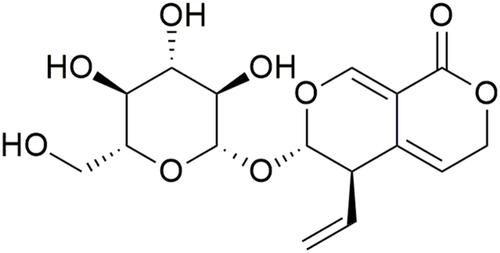
Table 3 Characteristics of PLGA NSs Unloaded/Loaded with GPS Prepared by Single Emulsion Solvent Evaporation Method
Figure 2 Transmission electron micrographs of GPS-PLGA NSs. F2: A&D, F5: B&E, and F8:C&F (Formulae code shown in ). Captured at low magnification; (A–C) and at high magnification: (D–F). Image J software utilized for measurements display.
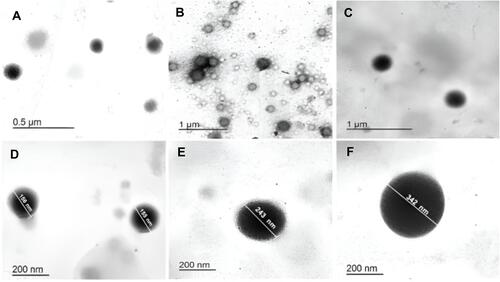
Figure 3 Transmission electron micrographs of GPS-PLGA NSs showing core/shell nanostructure. (A–C) for F2, F5, and F8 respectively. Image J software utilized for measurements display.
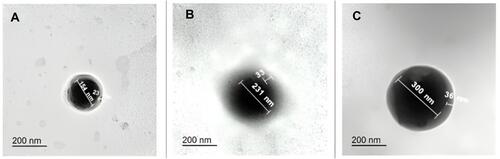
Figure 4 Transmission electron micrographs of placebo PLGA NSs showing unloaded centered core. (A–C) for P2, P5, and P8 respectively. Image J software utilized for measurements display.
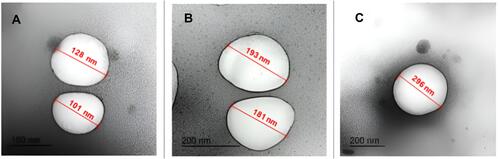
Table 4 Characteristic IR Peaks of GPS
Figure 5 FTIR spectrum of free GPS, PLGA 50:50, and GPS-PLGA NSs (F5).
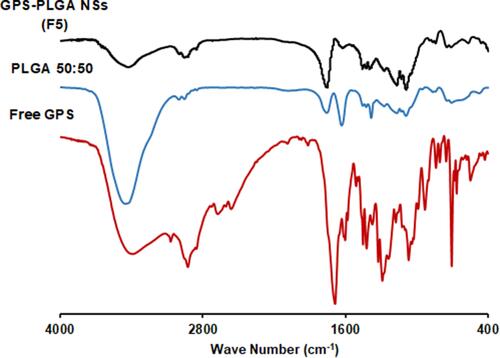
Figure 6 DSC thermograms showing endothermic peaks at 111.77, 52.12, and 51.52°C for free GPS, PLGA 50:50, and GPS-PLGA NSs (F5).
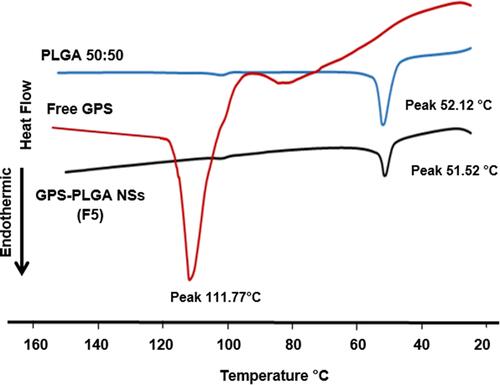
Figure 7 In vitro drug release profiles for GPS-PLGA NSs (Formulae keys shown in ). For clarification, error bars are shown as mean + SD (n=3). (A–C) platforms for GPS NSs prepared with PLGA at concentrations of 2.5, 5.0, and 7.5% w/v respectively. In vitro release behavior of free GPS is presented in (A) showing the sustained action of polymeric PLGA-GPS NSs. Similar patterns of GPS dispersed in 0.4 and 0.6% w/v of PVA (not shown).
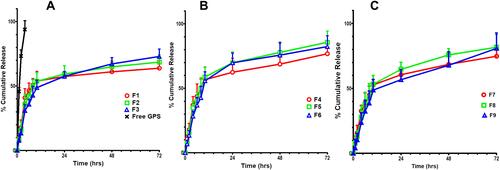
Table 5 Antibiotic Resistance Profile of the Tested Isolates
Figure 8 Growth curve of a representative S. aureus isolate; untreated control (circles), exposed to free GPS (cross) or GPS-PLGA NSs, F5 (squares).
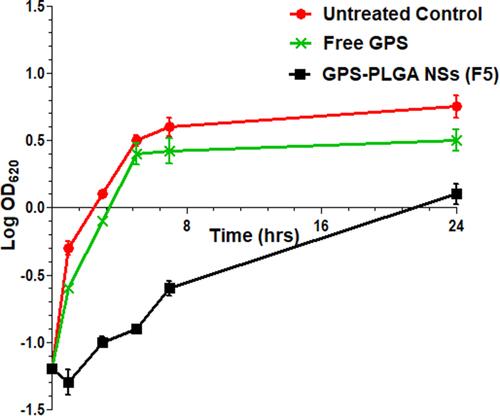
Figure 9 Scanning electron micrographs of a representative S. aureus isolate (A–C) for untreated control, treated with free GPS, and GPS PLGA NSs (F5) respectively.
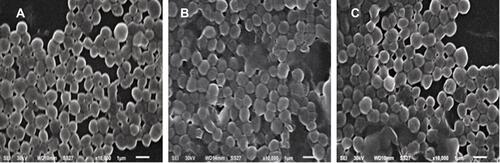
Figure 10 Macroscopic images of wound area showing healing and closure stages. The wound closure was observed at three-day intervals till day (12) post wound.
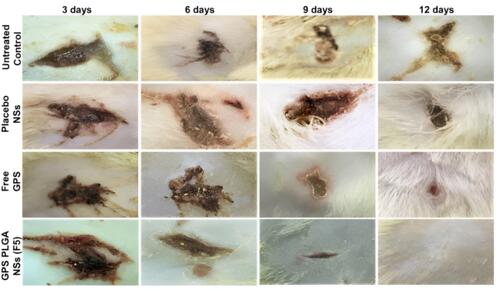
Figure 11 % wound injury index of untreated control (circles), placebo NSs (triangles), free GPS (cross) and GPS-PLGA NSs, F5 (squares) in male Sprague–Dawley rats. Results are expressed as means ± SEM. (n=6 per group, at each day interval). GPS-PLGA NSs were statistically (p < 0.05) different from untreated control, placebo NSs and free GPS at all day intervals (3, 6, 9, and 12 days). Untreated control and placebo NSs were non-significant different (p > 0.05).
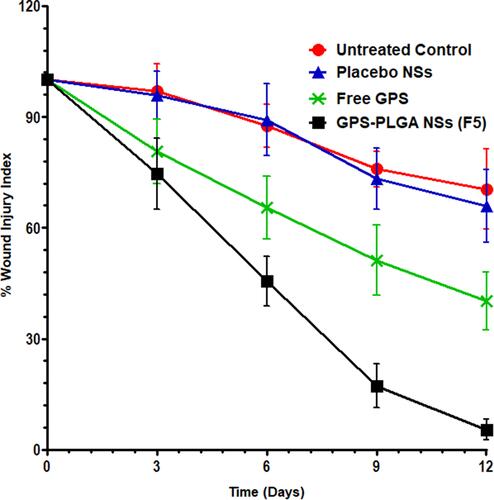
Figure 12 Wound healing process at day 3 and day 6-time interval in different groups. (A) Normal healthy, (B and C) Untreated Control, (D and E) Placebo NSs, (F and G) Free GPS, and (H and I) GPS - PLGA NSs (F5). H&E stain 40X. Arrow = Epidermal layer. Black star = Dermal layer, Red star = Wound gab granulation tissue.
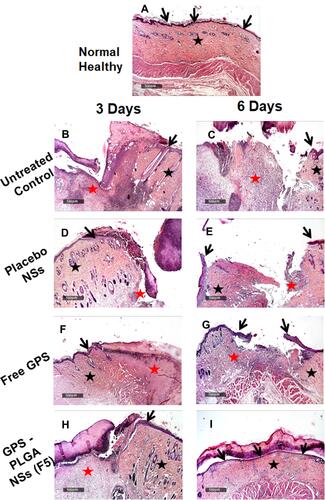
Figure 13 Wound healing process at day 9 and day 12-time interval in different groups. (A and B) Untreated Control, (C and D) Placebo NSs, (E and F) Free GPS, and (G and H) GPS - PLGA NSs (F5). H&E stain 40X. Arrow = Epidermal layer. Black star = Dermal layer, Red star = wound gab granulation tissue.
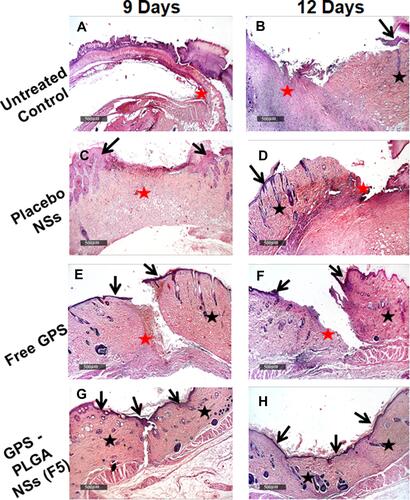
Figure 14 Reactive dermal collagen fibers (star) at day 9 and day 12-time interval in different groups. (A) Normal healthy, (B and C) Untreated Control, (D and E) Placebo NSs, (F and G) Free GPS, and (H and I) GPS - PLGA NSs (F5). Masson’s trichrome stain 40X.
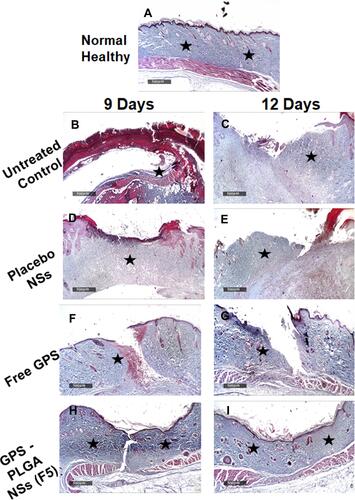
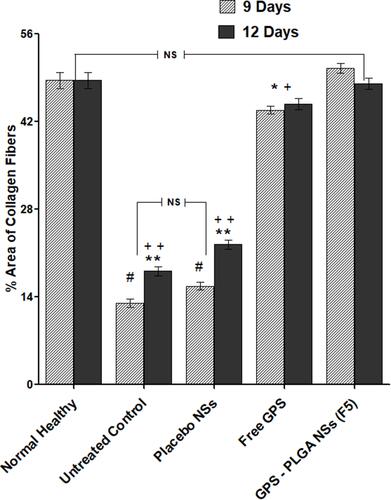
Figure 15 Quantitative analysis for immunohistochemical staining expressed as % area of collagen fibers. Data are represented as mean ± SEM, (n=6). **p<0.01; significantly different from normal healthy. ++p<0.01 significantly different from GPS-PLGA NSs (F5). #p<0.05; significantly different from free GPS. *+p<0.05 significantly different between free GPS and normal healthy and GPA-PLGA NSs (F5). NS; the non-significant difference between normal healthy and GPS-PLGA NSs & untreated control and placebo NSs.