Figures & data
Figure 1 (A) Schematic illustration of the synthesis procedure of Ce6-APHPBs and the mechanism of enhanced PDT for inhibiting tumor growth and reducing metastasis to the lung. Created with BioRender.com. (B) Transmission electron microscopy (TEM) images of Prussian blue (PBs), hollow Prussian blue (HPBs), hollow Prussian blue with in situ growth of Au-Pt (APHPBs) and Ce6-loaded hollow Prussian blue with in situ growth of Au-Pt (Ce6-APHPBs). (C) Dynamic light scattering (DLS) of HPBs, APHPBs and Ce6-APHPBs. (D) Absorbance spectra of HPB, free Ce6, APHPBs and Ce6-APHPBs. (E) Zeta potential of HPBs, APHPBs and Ce6-APHPBs. Error bars represent mean ± s.d. (n = 3) (F) Accumulative release of Ce6 in Ce6-HPBs and Ce6-APHPBs under different conditions (pH=6.5 and pH=7.4) over 24 h. Error bars represent mean ± s.d. (n = 3).
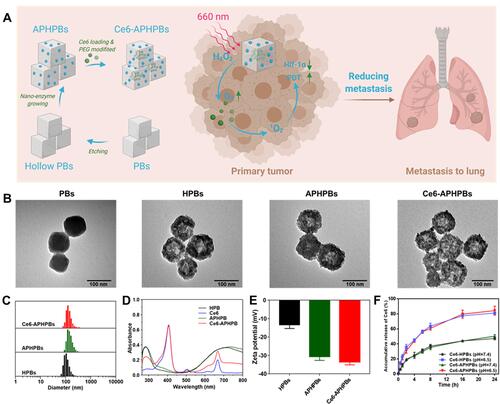
Figure 2 (A) Schematic diagram of Ce6-APHPBs for reducing overexpressed H2O2 and enhancing PDT under 660 nm irradiation. Created with BioRender.com. (B) Relative catalase (CAT) activity of HPBs and APHPBs at different concentrations showing excellent CAT activity of APHPBs. Error bars represent mean ± s.d. (n = 3) (C) UV–vis absorbance (405 nm) of Ti(SO4)2 solution after treatment with H2O2 at different concentrations (1.25 mM, 2.5 mM, 5 mM, 10 mM, 20 mM, 40 mM). (D) H2O2 (5 mM) degradation after treatment with PBS, HPBs (100 μg/mL) and APHPBs (100 μg/mL) for 80 min. Error bars represent the mean ± s.d. (n = 3) (E) O2 generation curve of H2O2 solution after treatment with PBS, HPBs and Ce6-APHPBs at different time points (H2O2: 5 mM, HPBs: 100 μg/mL and APHPBs: 100 μg/mL). (F) The ability to produce singlet oxygen (1O2) treated with various groups under 660 nm light (1 min at a time, 300 mW/cm2). P values in b were calculated by multiple t tests (***P < 0.001).
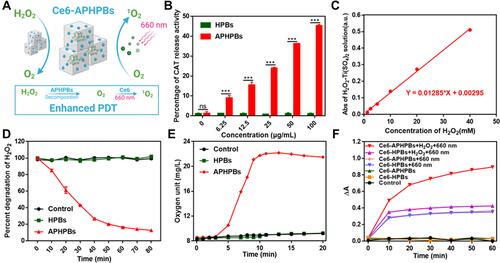
Figure 3 (A) Fluorescence microscopy imaging of 4T1 cells stained with DCFH-DA for detecting the reactive oxygen species (ROS) after treatment with PBS, Ce6 plus 660 nm, Ce6-HPBs plus 660 nm and Ce6-APHPBs plus 660 nm (Ce6: 4 μg/mL, Ce6-HPBs: 100 μg/mL, Ce6-APHPBs: 100 μg/mL, irradiation time: 8 min). (B) Relative cell viability of HUVECs and 4T1 cells after incubation with APHPBs at different concentrations for 24 h. Error bars represent the mean ± s.d (n = 3). Relative cell viability of 4T1 cells after treatment with different methods for different irradiation times in normal oxygen (C) and hypoxia (D). Error bars represent mean ± s.d. (n = 3) (E) Fluorescence microscopy images of live/dead stained 4T1 cells after treatment with different formulations (irradiation time: 8 min, 300 mW/cm2) and for an additional 24 h incubation. P values in c and d were calculated by multiple t tests (***P < 0.001).
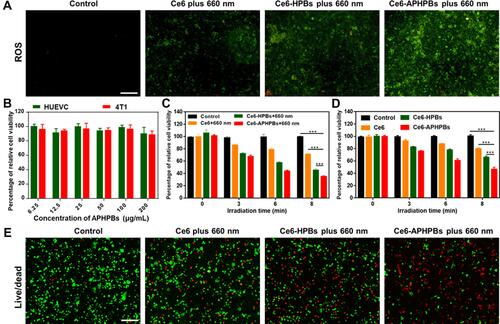
Figure 4 (A) Photoacoustic imaging showing tumors deoxyhemoglobin (Hb) and oxyhemoglobin (HbO2) preinjection and i.v. injection of Ce6-APHPBs (2 mg/mL, 200 μL) at 12 h. (B) Statistical data of the signal value of Hb or HbO2 at 12 h. Error bars represent the mean ± s.d. (n = 3). (C) Confocal hypoxia-fluorescence images of tumor slices collected from mice 12 h post-i.v. injection of PBS or Ce6-APHPBs (2 mg/mL, 200 μL). The cell nuclei and hypoxic areas were stained with DAPI (blue) and anti-pimonidazole antibody (FITC-green). (D) Immunofluorescence slices of HIF-1α expression in tumors (blue: nucleus, green: HIF-1α). Scale bar: 50 μm. P values in b were calculated by multiple t tests (**P < 0.01).
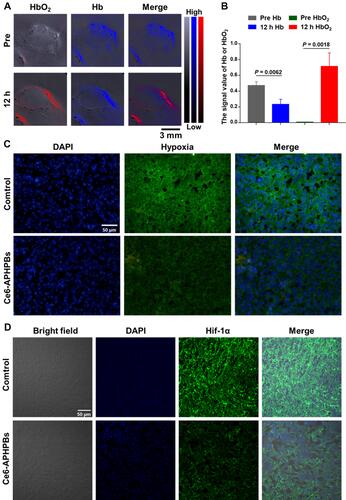
Figure 5 (A) Schematic diagram of Ce6-APHPBs suppressing the growth of tumors and reducing metastasis to the lung. Created with BioRender.com. (B) Tumor growth curves measured for 14 days and (C) tumor volume at day 14 after different treatments. (D) Mouse survival curve in each group 30 days after treatments. Error bars represent mean ± s.d. (E) Hematoxylin and eosin (H&E)-stained tumor slices after intravenous injection in various groups at 7 days. (F) TUNEL-stained tumor slices of different groups at 7 days post-treatment. Scale bar: 200 μm. (G) H&E-stained lung slices of mice after various treatments at 20 days. Scale bar: 500 μm. P values in c were calculated by multiple t tests (***P < 0.001). (Ce6: 80 μg/mL, Ce6-HPBs: 2 mg/mL, Ce6-APHPBs: 2 mg/mL, 200 μL for each injection, irradiation time: 16 min at a time).
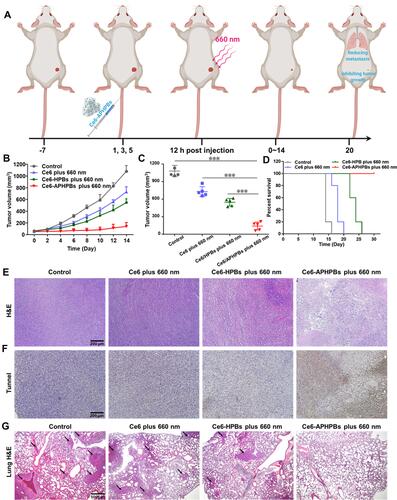
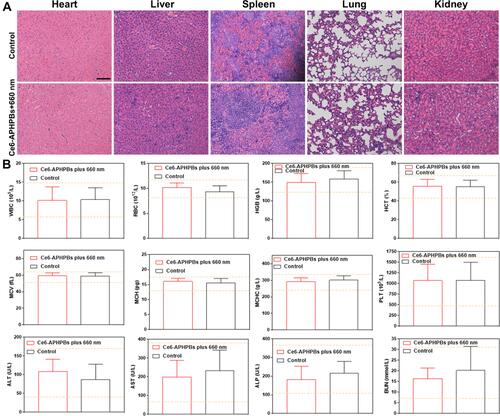
Figure 6 In vivo biosafety analysis of enhanced PDT by Ce6-APHPBs. (A) Typical hematoxylin-eosin (H&E)-stained slice imaging of mean organs, including the liver, spleen, kidney, lung and heart, gathered on day 10 after i.v. injection of Ce6-APHPBs+660 nm. (B) Blood biochemical and hematological data (including white blood cells (WBCs), red blood cells (RBCs), hemoglobin (HGB), hematocrit (HCT), mean cell volume (MCV), mean cell hemoglobin (MCH), and mean cell hemoglobin concentration (MCHC)). Blood urea nitrogen (BUN), alanine aminotransferase (ALT), alkaline phosphatase (ALP) and aspartate aminotransferase (AST) levels in BALB-c mice on day 10 after Ce6-APHPB+660 nm injection (5 mice per group). Scale bar: 100 μm.