Figures & data
Figure 1 (A) Schematic illustration showing the synthesis of NRA QDs, DEX-HA gel, and multifunctional NRA@DH Gel. (B) Schematic representation of the in vivo mechanisms underlying synergistic therapy with NRA@DH Gel including accumulation in tumor tissues, deep penetration, and sustained ROS generation.
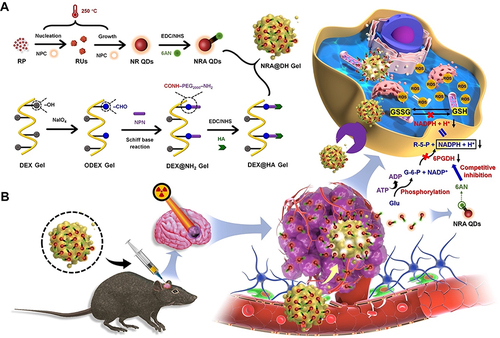
Figure 2 (A) TEM images of NRA QDs. (B) SEM image and corresponding elemental mapping images of NRA@DH Gel. (C) FT-IR spectra of pure RP and NRA@DH Gel. (D) UV−vis absorption and fluorescence spectra of NRA@DH Gel. (Ex = 610 nm; Em = 840 nm). Inset shows fluorescent image. (E) Fluorescence stability of NRA@DH Gel after one month. (F) Photographs of NRA QDs, DEX gel, and NRA@DH Gel. (G and H) Rheological properties of NRA@DH Gel at varying pH levels. (I) pH-controlled encapsulated NRA QDS release curves for NRA@DH Gel at pH 7.4, 6.5, and 5.5 over 72 h.
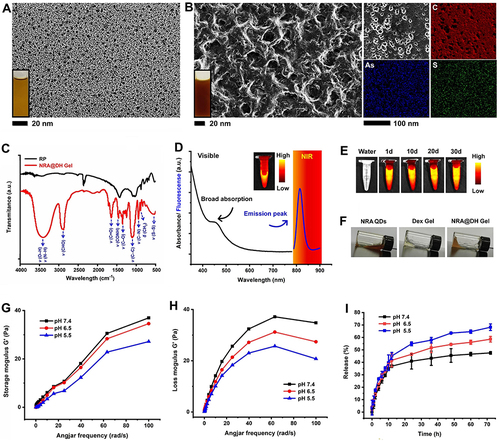
Figure 3 (A) Concentration-dependent cell viability of GL261 cells after treatment with NRA@DH Gel and (B) empty DH Gel. (C) Concentration of GSH/GSSG after different treatments in GL261 cells. (D) The concentration of GSH after treatment with different concentrations of NRA QDs in GL261 cells. (E) Fluorescence intensity of ROS after different treatments in GL261 cells. (F) Digital images of colony formation after treatment with PBS and NRA@DH Gel under 0, 2, 4, and 6 Gy radiation. (G) Colony formation curves of GL261 cells treated with PBS and NRA@DH Gel under 2, 4, 6 and 8 Gy radiation. (H) Specific nuclear targeting effect of NRA@DH Gel on GL261 cells observed by CLSM. Cell nuclei stained with DAPI are shown in blue and fluorescent NRA@DH Gel is shown in red. (I) Apoptosis and necrosis in response to different treatments as measured by Annexin V-FITC/PI double staining detected by FCM. (J) Changes in ΔΨm using JC-1 dye as detected by FCM following different treatments. (K) In vitro metastatic activity of GL261 cells determined by transwell migration assay in response to different treatments.
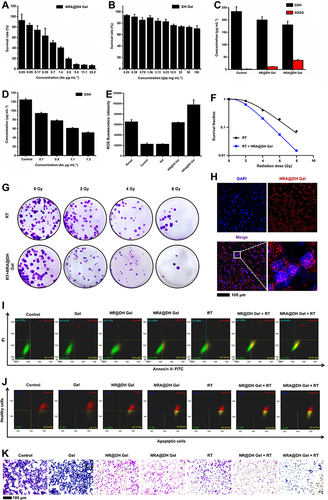
Figure 4 (A) Real-time in vivo fluorescence images (Ex = 610 nm; Em = 840 nm) of GL261 tumor- bearing mice after intratumoral injection of NRA QDs and NRA@DH Gel over a 6-day period (administered dose, 0.5 mg As kg−1 body weight). (B) Corresponding fluorescence signal-based CI values at tumor sites and adjacent normal brain tissue at different times post-administration (0–6 days). (C) Ex vivo fluorescence imaging of heart, liver, spleen, lung, kidneys, and tumor tissues collected after the injection of NRA@DH Gel at different times post-administration (1, 2, 3, and 6 days). (D) CLSM images of tumor cryosections after treatment with fluorescent NRA@DH Gel. Cell nuclei stained with DAPI are shown in blue and NRA@DH Gel is shown in red.
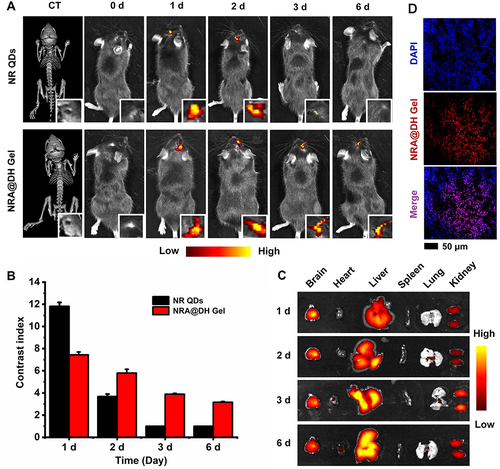
Figure 5 (A) Experimental schematic of NRA@DH Gel- mediated synergistic therapy in two stages (7 days per stage for a total of 14 days, single dose of 0.85 mg As kg−1 body weight). GL261 tumor-bearing mice were randomly divided into seven groups. (B) Images of H&E and Masson staining of tumor tissues after 16 days of treatment. (C) IHC staining for HIF-1α, CD31 and Ki-67 in tumor tissue sections after 16 days of treatment. (D) Western blotting of Flot 2 and GPR 56 in tumor tissues from GL261 tumor -bearing mice (*p < 0.05, **p< 0.01, ***p < 0.001).
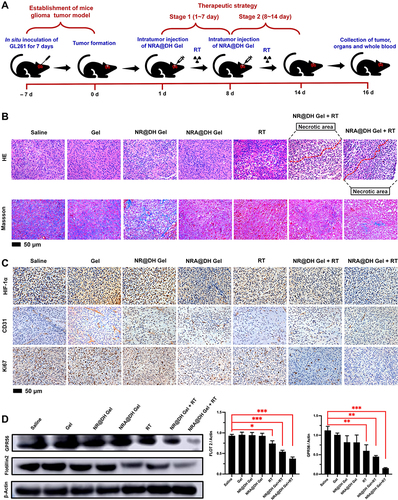
Figure 6 (A) H&E staining of murine brain tissue following different treatments over a period of 16 days. (B) In vivo bioluminescence in glioma-bearing mice following different treatments at 1, 8, and 16 days. (C) Quantitative bioluminescence analysis of tumor area ratio (TAR) at day 16 and day 1. (D) Images of H&E staining of normal organ tissues from mice after 16 days of treatment. (E) Routine serological parameters (WBC, RBC, PLT, HGB, HCT, MCV, and MCH) and liver and kidney function parameters (AST, ALP, ALT, BUN, and CREA) in blood collected from mice. (F) Body weight changes in indicated groups over the 16-day observation period.
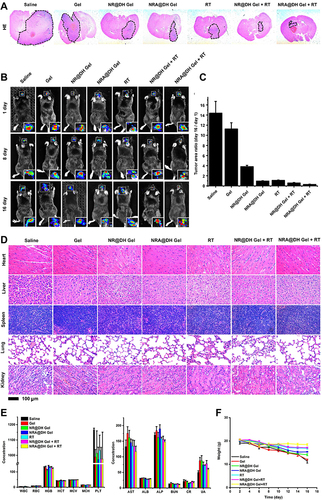
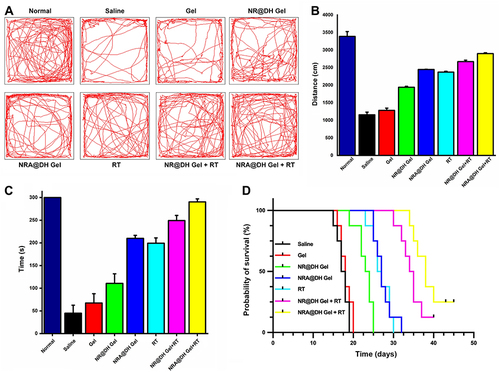
Figure 7 (A) Trajectory maps and (B) numerical statistics of open field tests in different groups. (C) Numerical statistics from the rotarod test in different groups. (D) Survival curves of mice in different groups (n = 8 per group).