Figures & data
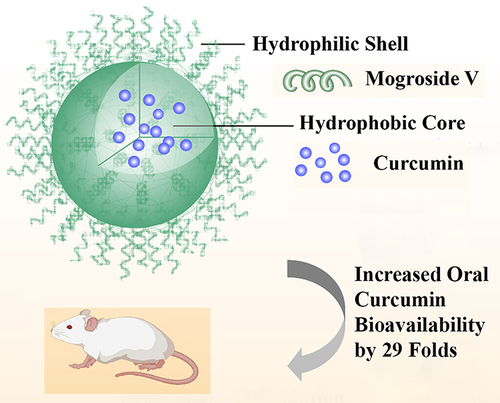
Table 1 Solubilisation of CUR Using Different Formulations
Table 2 Studies Using Glycosides to Solubilise Poorly Water-Soluble Drugs
Figure 1 Chemical structures of (A) Mogroside V (Mog-V) and (B) Curcumin (CUR) with protons of representative chemical shifts numbered. Schematic representation of the solubilisation mechanism: self-assembly of Mog-V micelles in aqueous solution to encapsulate CUR (C).
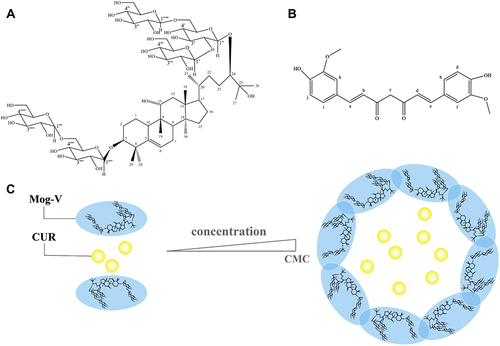
Figure 2 Power X-ray diffraction diagrams and differential scanning calorimetry thermograms of (A) SDPs, (B) PMs, (C) Mog-V, and (D) CUR.
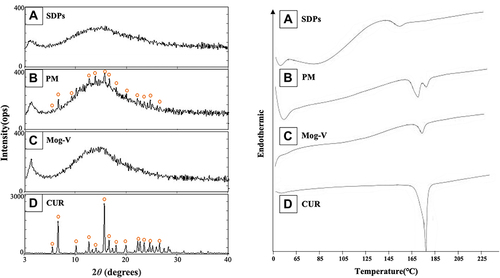
Figure 3 Particle size distribution of (A) Mog-V and (B) CUR/Mog-V SDPs in water (including the cumulative distribution curves of particle size). Dissolution profile of CUR in (C) pH 1.2, (D) pH 6.8 buffer solutions each containing 0.2% Tween 80 at 37°C. ■, CUR, ●, CUR/Mog-V SDPs.
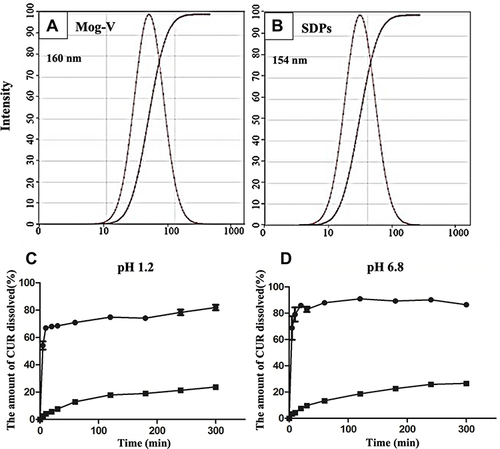
Figure 4 1H NMR spectra of Mog-V solution at concentrations of 1–50 mg/mL recorded in D2O (A). Plots of (B) δobs against 1/C and (C) log (C(δobs-δmon)) against log (C(δmic-δobs)) for the H-30 peak from the 1H NMR spectra. 2D 1H-1H NOESY spectra of Mog-V at (D) 1 mg/mL (below CMC) and (E) 50 mg/mL (above CMC).
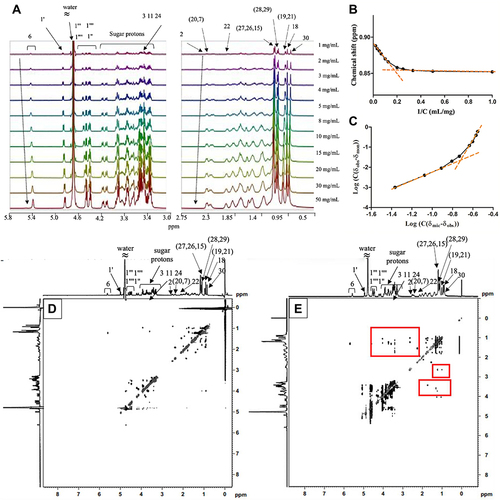
Figure 5 1H NMR spectra of (A) Mog-V, 50 mg/mL; (B) CUR/Mog-V SDPs, 55 mg/mL. 2D 1H-1H NOESY spectra of (C) Mog-V and (D) CUR/Mog-V SDPs.
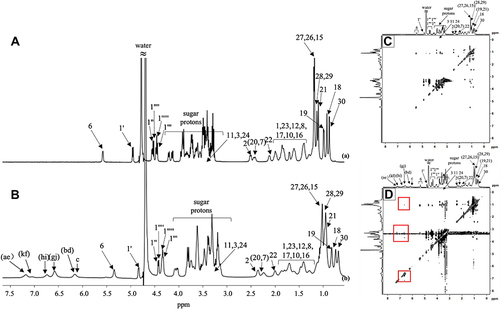
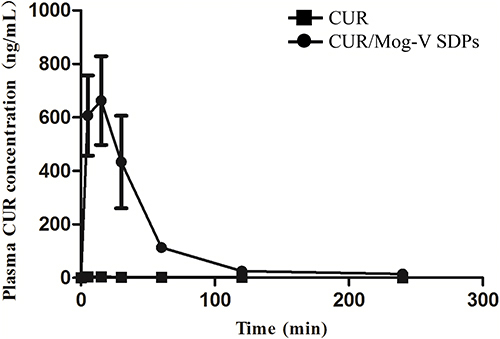
Table 3 The Oral Absorption of CUR Crystal and CUR/Mog-V SDPs in Rats
Figure 6 Plasma concentration-time profiles in rats after oral administration of CUR crystal and CUR/Mog-V SDPs. ■, CUR; ●, CUR/Mog-V SDPs. N = 4.