Figures & data
Figure 1 (A) Schematic of a zeolite supercage of the faujasite family of zeolites (B) High-resolution transmission electron microscope (TEM) images of nanozeolite particles. Scale bar = 100 nm. (C) Structure of the quat benzalkonium nitrate (BZN). (D) Binding of positively charged BZN to a negatively charged zeolite surface.
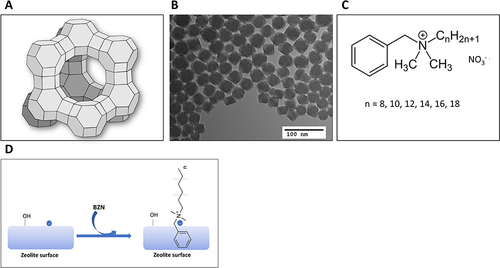
Figure 2 (A) 2 HCT (hour count, 2h), (B) 4 HCT (hour count, 4h) and (C) 24 HCT (hour count, 24h) exposure of AM30, AV30 and zeolite control (ZC) in suspensions at concentrations of 0.1, 1, 10, 100, 1000 and 10,000 ppm to SARS-CoV-2 (D) 10 mCT (minute count, 10 min) challenge of SARS-CoV-2 against 5, 10, 20, 40, 100, 250 and 500 ppm BZN in suspension. Error bars show SEM, N=3. Statistical significance was determined using Holm–Sidak’s Multiple comparisons t-test. *P<0.05, **P<0.01, ***P<0.001.
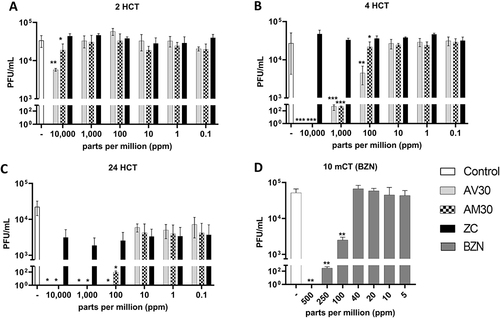
Figure 3 Zeolite-coated cotton fabrics exposed to SARS-CoV-2 for (A) 10 mCT (minute count, 10 min) and (B) 2 HCT (hour count, 2h) and (C) 24 HCT (hour count, 24h). Concentrations of actives used were BZN (220 µg/cm2), AM30 and AV30 (100 µg/cm2). + Sign indicates the presence of the actives and – sign indicates its absence. Error bars show SEM, N=3. Statistical significance was determined using 2-way ANOVA multiple comparisons. *P<0.05, **P<0.01, ****P<0.0001.
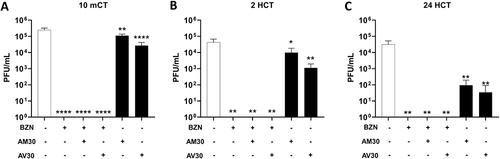
Figure 4 Zeolite-coated cotton fabrics with variable concentrations of actives exposed to SARS-CoV-2 for 10 min (10 mCT- ten-minute count). Concentrations of actives used were: BZN (22, 66, and 110 µg/cm2); AV30 and AM30 (100 µg/cm2). + Sign indicates the presence of the actives and – sign indicates its absence. Error bars show SEM, N=3. Statistical significance was determined using 2-way ANOVA multiple comparisons. **P<0.01, ****P<0.0001.
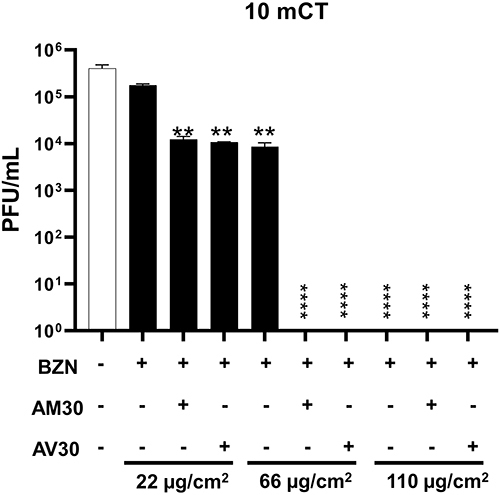
Figure 5 Zeolite-coated polyester fabrics exposed to SARS-CoV-2 for (A) 10-mCT (minute count, 10 min) and (B) 24 HCT (hour count, 24 h). Concentrations of actives used were: BZN (220 µg/cm2), AM30 and AV30 (100 µg/cm2). + Sign indicates the presence of the actives and – sign indicates its absence. Error bars show SEM, N=3. Statistical significance was determined using 2-way ANOVA multiple comparisons. *P<0.05, **P<0.01, ***P<0.001.
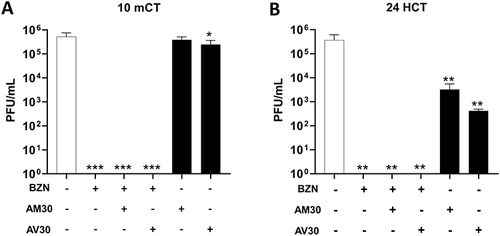
Figure 6 Zeolite-coated polyester fabrics with variable concentrations of actives exposed to SARS-CoV-2 for 10 min (10 mCT- ten-minute count). Concentrations of actives used were: BZN (22, 66, and 110 µg/cm2); AV30 and AM30 (100 µg/cm2). + Sign indicates the presence of the actives and – sign indicates its absence. Error bars show SEM, N=3. Statistical significance was determined using 2-way ANOVA multiple comparisons. **P<0.01, ****P<0.0001.
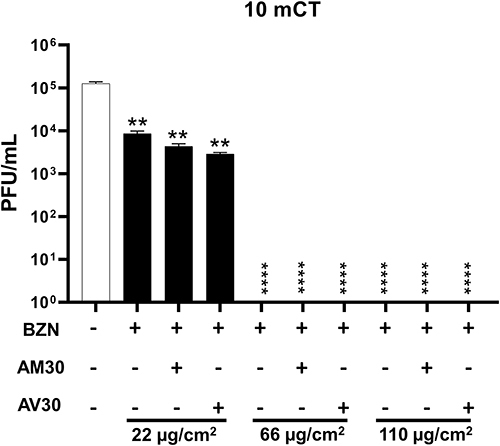
Figure 7 (A) Arrangement of the 96-well checkerboard pattern for testing variable concentrations combining BZN (0–50 ppm in steps of 2) and AM30 or AV30 (0–10,000 ppm in steps of 10). V and M columns indicate virus-only and mock controls, respectively. (B) Two-variable concentration checkerboard-pattern assay of AV30 and AM30 at 100, 10, and 1 ppm with 0–50 ppm BZN.
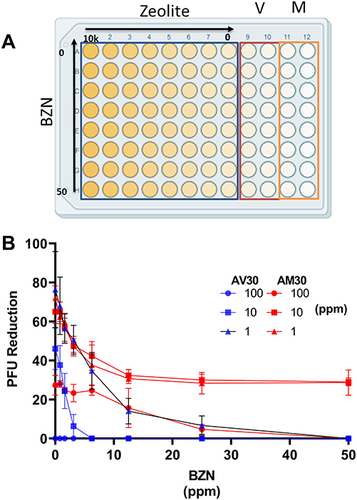
Figure 8 (A) Testing of the antiviral potency of coated polyester samples to washing with water and detergent. Exposure time to SARS-CoV-2 for 10 min (10 mCT) of BZN-coated with or without AV30 samples previously subjected to 5 cycles of simulated wash with or without detergent. Concentrations of actives used were: BZN (66 µg/cm2) and AV30 (100 µg/cm2). + Sign indicates the presence of the actives and – sign indicates its absence. (B) Testing of the antiviral potency of coated polyester samples exposed to soil loads (soil solution was made by mixing three solutions of 0.5 g of bovine serum albumin in 10 mL PBS, 0.5 g yeast extract in 10 mL PBS, and 0.04 g of mucin in 10 mL PBS). Exposure time of 10 min (10mCT) to SARS-CoV-2 of BZN-coated with or without AV30 polyester samples previously treated with soil-like particles, SL100 or SL200. Concentrations of actives used were: BZN (66 µg/cm2) and AV30 (100 µg/cm2); SL100 (soil load = 5.5 µL/cm2), SL200 (soil load = 11 µL/cm2). + Sign indicates the presence of the actives and – sign indicates its absence. (C) Testing of the antiviral potency of coated polyester samples after 5 repeated insults with SARS-CoV-2 each for 10 min (10 mCT) for BZN-coated with or without AV30. Concentrations of actives used were BZN (66 µg/cm2) and AV30 (100 µg/cm2). The experiment began with 5 textile samples on which the virus was deposited. After 10 min, one of the textile pieces was analyzed for virus, and the rest was treated with a similar viral load as the first sample. This process was repeated 5 times. Error bars show SEM, N=3. Statistical significance was determined using 2-way ANOVA Multiple comparisons. *P<0.05, **P<0.01, ***P<0.001, ****P<0.0001.
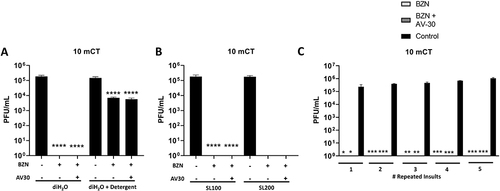
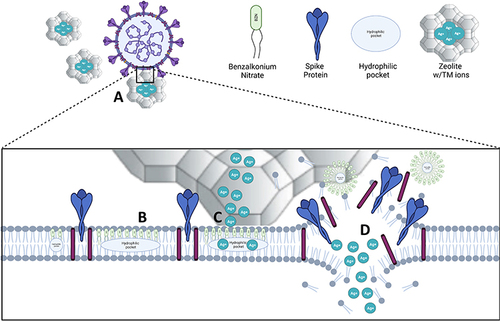
Figure 9 Diagram of antiviral mechanism of action against SARS-CoV-2. (A) TM-containing zeolites comes in contact with the viral particles via electrostatic charge. (B) Benzalkonium nitrate (BZN) permeates the envelope and forms hydrophilic pockets in the lipid bilayer. (C) Metal ions diffuse through the envelope and enter the virion, targeting the inner viral components. (D) BZN disrupts the viral envelope and induces greater metal ion influx.