Figures & data
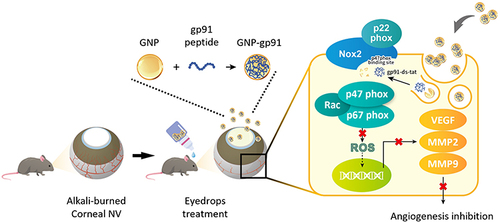
Figure 1 Schematic illustration of gp91ds-tat peptide (gp91)-loaded gelatin nanoparticles (GNP-gp91) as eye drops to treat alkali-burned induced corneal neovascularization (NV) in a mouse model.
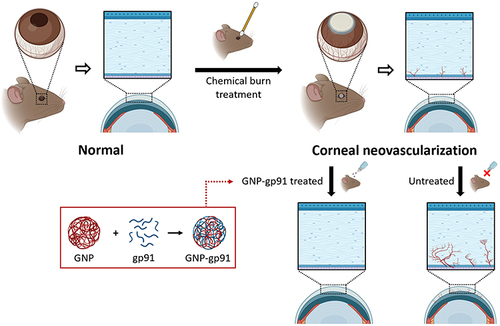
Table 1 Characterization of GNP and GNP-gp91 Prepared in Variant pH
Figure 2 Characterization of GNPs and GNP-gp91. (A) DLS results of size and zeta potential of GNP and GNP-gp91 at pH8. (B) Photograph of gelatin solution and GNP/GNP-gp91 colloidal solutions. (C) TEM image of GNP-gp91, scale bar: 10 µm. (D) The cumulative drug release profile of gp91 and GNP-gp91 in PBS at pH 7. Data are expressed as mean ± SD, n = 3.
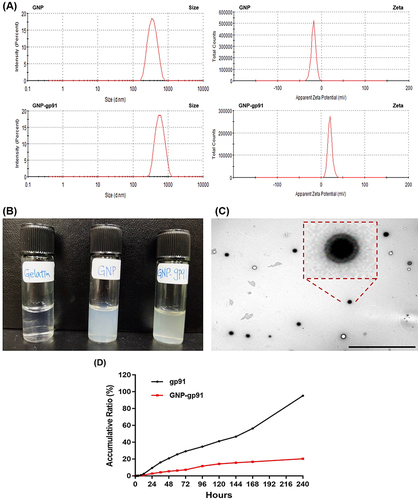
Figure 3 Cell interaction with GNP-gp91. (A) Flow cytometric histograms of gp91FITC- and GNP-gp91FITC-treated cells, and (B) its quantification data of intracellular MFI (n = 3, *p < 0.05, compared with gp91FITC). (C) Cell viability of HUVECs incubated with variant formulation at gp91 concentration from 50 to 150 µg/mL on day 1 and day 3 (n = 5, *p < 0.05, **p < 0.01). (D) Representative images of Live/Dead staining of HUVECs cultured with variant peptide formula (100 μg/mL) acquired on day 3, scale bar: 250 µm. (E) ROS changes in LPS-induced inflamed cells. (n = 3).
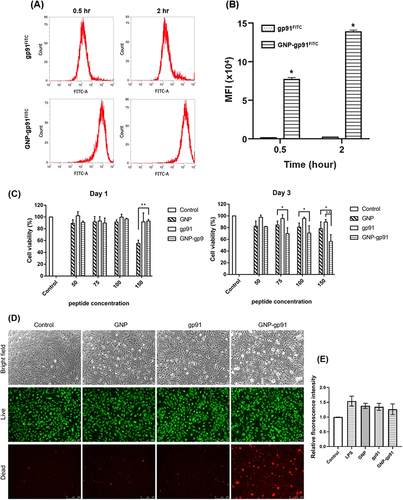
Figure 4 Effects of GNP-gp91 on cell migration and tube formation. (A) Representative photos from wound healing assay of HUVECs treated with GNP, gp91, and GNP-gp91. Scale bar: 250 µm. (B) Quantification of wound closure rate at the indicated times (n = 3), *p < 0.05, **p < 0.001 compared with GNP-gp91 group. (C) Representative images of tube formation after culturing for 8 h, scale bar: 250 µm.
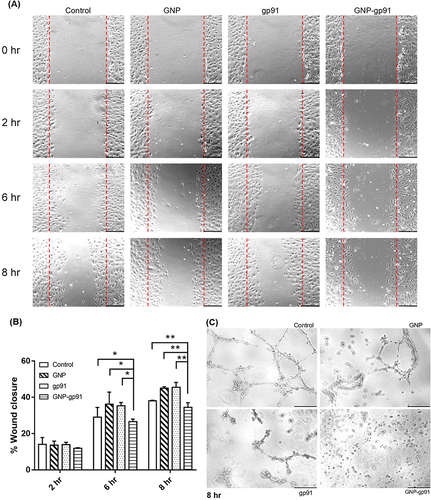
Figure 5 Ocular retention and distribution of GNP-gp91. (A) Photo to show fluorescence accumulated on normal mice eye treated by GNPTAMRA, free dye (TAMRA), and GNP-gp91TAMRA after 10 minutes dosing, and (B) its intensity variation curve changed with time. (C) Photo of neovascularized mice eye treated by variant fluorescent formulation after 10 minutes dosing, and (D) its intensity variation curve changed with time. Data are presented as mean ± SD (n = 3). (E) Corneal cryosections revealing the distribution of free dye, GNPTAMRA, and GNP-gp91TAMRA in cornea (yellow arrow in TAMRA images indicated dye or NPs location). Scale bar: 250 µm. Corneal epithelium: Ep, Stroma: St, endothelium: Ed.
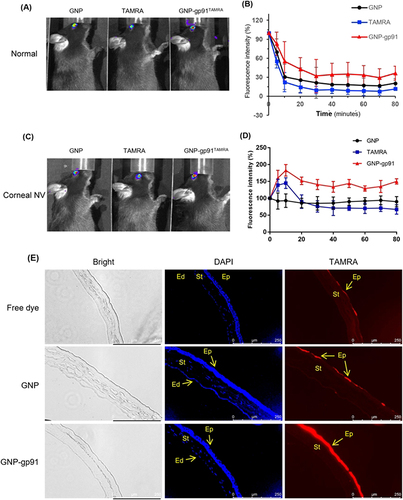
Figure 6 Eyedrops containing GNP-gp91 can inhibit vessel formation in chemical cauterization-induced corneal neovascularization. (A) Representative images of cornea from normal eye, and PBS, gp91, and GNP-gp91NP-treated corneal NV. (B) The area of blood vessels in the cornea was quantified using Image J software. Data are presented as mean ± SD (Normal: n = 3. PBS, gp91, and GNP-gp91: n = 6). **p < 0.001 compared with GNP-gp91 group. (C) Histological assessment of central corneal sections after 7 days treatment. Inflammatory cell infiltrating into the stroma (red arrows) and exhibiting defective corneal epithelium (black arrows) was observed in the PBS group compared with the control group. Epithelium: Ep, stroma: St, endothelium: Ed.
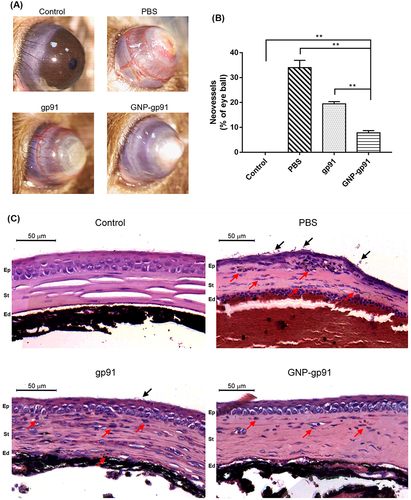
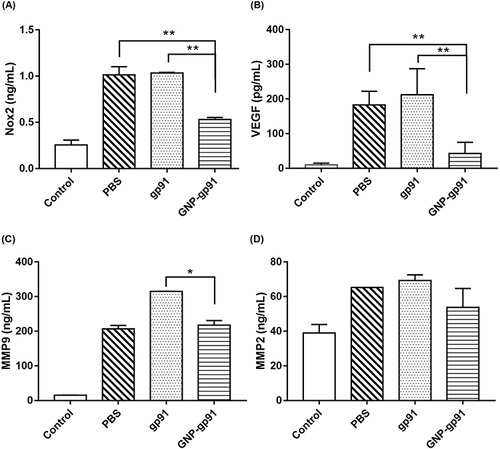
Figure 7 Quantification of angiogenic cytokines from cornea protein lysate. Mice received chemical cauterization and were treated with PBS, gp91, and GNP-gp91 eye drops. Quantification of (A) Nox2, (B) VEGF, (C) MMP9, and (D) MMP2 levels from the cornea lysates. Data are presented as mean ± SD (n = 3), *p < 0.05, **p < 0.001 compared with GNP-gp91 group.