Figures & data
Table 1 Physicochemical and Biological Properties of Leuprolide (LEU) Acetate
Table 2 Physicochemical Properties of Different Chain Lengths of Fatty Acid-NHS Esters
Figure 1 Schematic diagram for the synthesis of amine-group targeted LEU–palmitic acid conjugate (LPC).
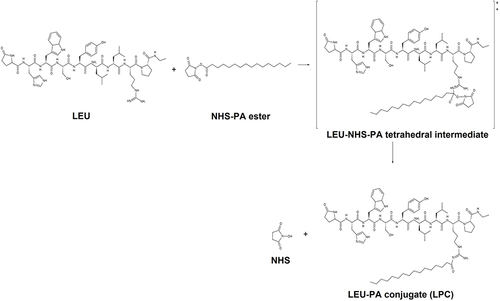
Table 3 Prep-HPLC Gradient Conditions for LEU–Fatty Acid Conjugate (LFC) Purification
Table 4 Quantitation of Free Amine Groups of LEU Acetate and LFCs
Figure 2 FT-IR spectra of LEU acetate, NHS-FA esters, physical mixtures of LEU and NHS-FA esters, and three conjugates (LFCs).
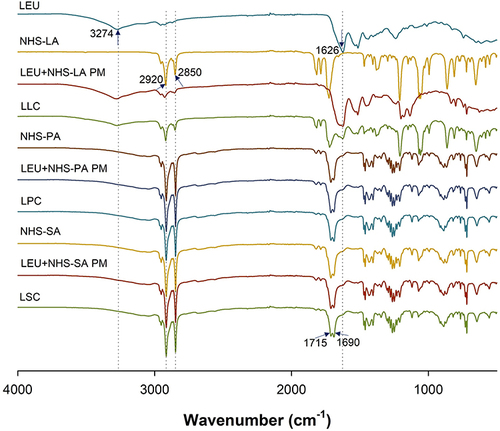
Figure 3 1H-NMR spectra of (a) LEU acetate, (b) LEU–lauric acid conjugate (LLC), (c) LEU–palmitic acid conjugate (LPC), and (d) LEU–stearic acid conjugate (LSC).
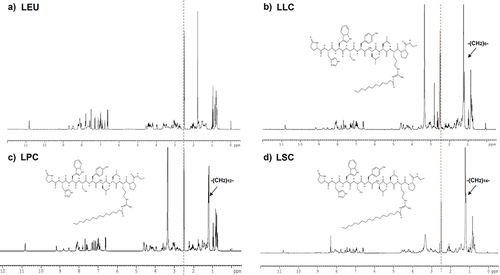
Figure 4 MALDI-TOF analysis of (A) LEU acetate, (B) LEU–lauric acid conjugate (LLC), (C) LEU–palmitic acid conjugate (LPC), and (D) LEU–stearic acid conjugate (LSC).
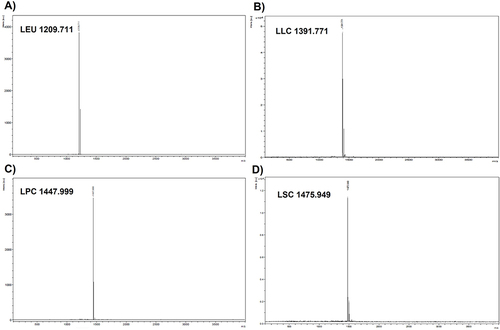
Figure 5 DSC thermograms of LEU acetate, NHS-FA esters, physical mixtures of LEU and NHS-FA esters, and three conjugates (LFCs). (A) LLC, (B) LPC, and (C) LSC.
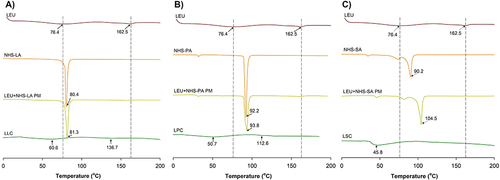
Table 5 Physicochemical Properties of Self-Assembled LEU-FA Nanoparticles (LFNs)
Figure 6 Self-assembly characterizations of LFCs. (A) and (B) Secondary structure analysis of LEU and LFCs by CD spectroscopy in water and in TFE/water at ratio 50:50 (v/v), respectively. (C) SEM morphology of LEU and three LFNs, (D) short-time stability of LFNs in PBS pH 7.4, (E) short-time stability of LFNs in mimicking physiological condition (5% HSA in PBS pH 7.4), and (F) permeation profiles of LEU and self-assembled LFCs (LFNs) through permeation barrier-membrane (PB-M) using Franz diffusion cells (n = 3).
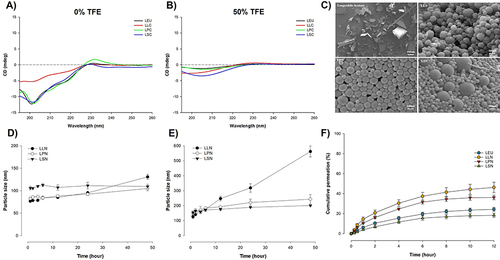
Figure 7 Degradation profiles in human plasma of (A) LEU, (B) LFCs, and (C) conversed LEU concentration from LLC, LPC, and LSC (n = 3).
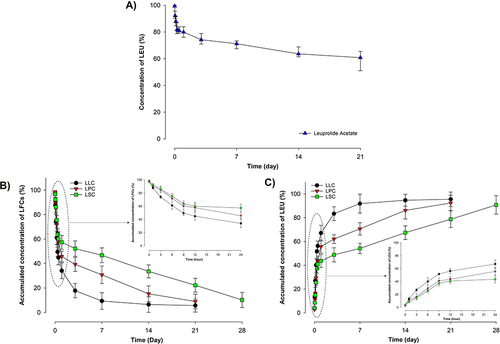
Table 6 The IC50 and SI Values of LFCs in Cancer and Non-Cancerous Cells
Figure 8 Cytotoxicity of LFCs against cancer cells and non-cancerous cell lines after 24 h of incubation by WST-1 assay. (A) Human prostate cancer cells (PC3), (B) human dermal fibroblasts (HDFs), and (C) human foreskin fibroblasts (HFF-1).
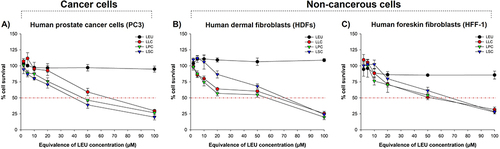
Figure 9 Antiproliferative effect in 2D monolayer culture. (A) Cell proliferation after the treatment of LEU and three FAs at three concentrations (50, 100, 200 μM) after 72 h. (B) Cell proliferation after the treatment of three FAs at 50 μM with different concentration of LEU (50, 100, 200 μM) after 72 h. (C) Cell proliferation after the treatment of three FAs, three LFCs and physical mixtures of LEU and FAs at 50 µM after 72h. (D) Inhibition of cell proliferation after the treatment of LEU and three LFCs repeated daily at a dose of 50 µM for 4 days. (E) Live/dead images of cell proliferation after the treatment of LEU and three LFCs repeated daily at dose of 50 µM for 4 days (scale bar: 250 µm) (n = 3). ***p < 0.001, **p < 0.01, analyzed by one-way ANOVA test.
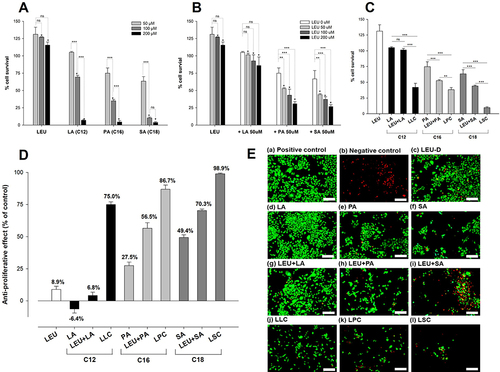
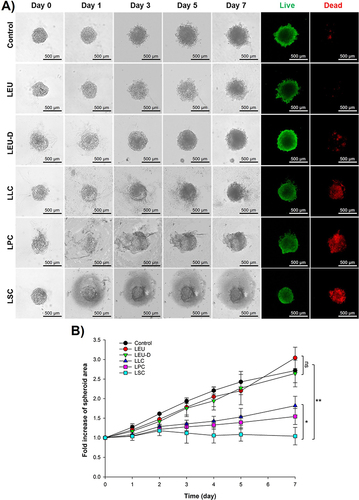
Figure 10 Anti-tumor effect in 3D spheroid culture. (A) Observation of 3D spheroid cultures of PC3 treated with LEU, LEU-D, and three LFCs for 7 days. (B) Fold increase of spheroid area after treatment of LEU, LEU-D, and three LFCs for 7 days (n = 3). **p < 0.01, *p < 0.05, analyzed by one-way ANOVA test.