Figures & data
Figure 1 Structure of HDGF and FDA-approved BTK inhibitors (A). Proposed mechanism of action of HDGF in RAJI cells. Image created with BioRender.com (B).
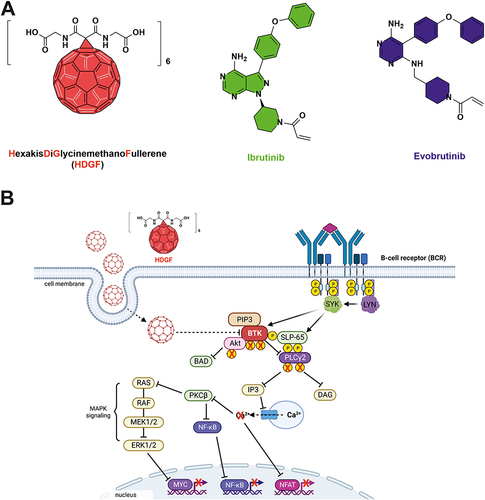
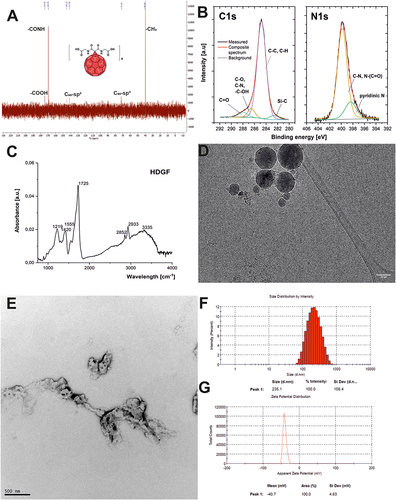
Figure 2 Physico-chemical characterization of fullerene nanomaterial HDGF: (A) The 13C-NMR spectrum; (B) A high-resolution XPS spectra of C1s and N1s; (C) The FT-IR spectrum; (D) Cryo-transmission electron microscopy; (E) Transmission electron microscopy; (F) Dynamic light scattering measurements; (G) Zeta potential measurements.
Scheme 1 Synthetic protocol for obtaining fullerene nanomaterial 4.
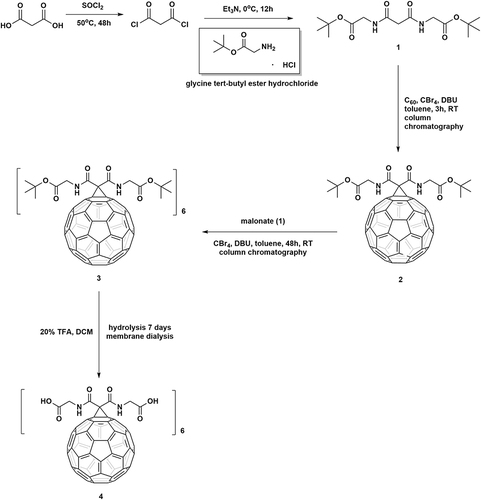
Table 1 Inhibitory Activity of Tested HDFG Against a Panel of Tyrosine Kinases
Figure 3 (A) Identification of the HDGF binding pocket in the BTK three-dimensional structure. (B) Electrostatic (on the left) and surface (on the right) complementarity between HDGF and BTK. (C) Accessibility of Tyr551 before (on the left) and upon (on the right) HDGF binding. (D) ΔGbinding between HDGF and BTK broken down by residue.
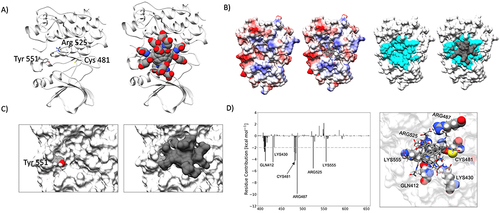
Figure 4 Antiproliferative activity of HDGF and ibrutinib against K562 and RAJI cells (*value for lymphoma taken from ref.) (A). The effects of the tested compounds on the expression of genes associated with autophagy (B) and the expression of proteins related to the apoptosis process (C). The calcium levels after exposure to the tested compounds in RAJI cells (D). Statistical significances were calculated using one- or two-way ANOVA with Dunnett’s post hoc test: **p < 0.01, ***p < 0.001, ****p < 0.0001 compared with the untreated cells (control).
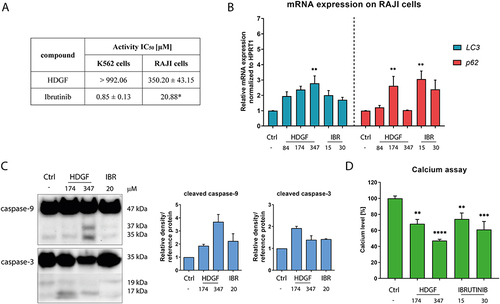
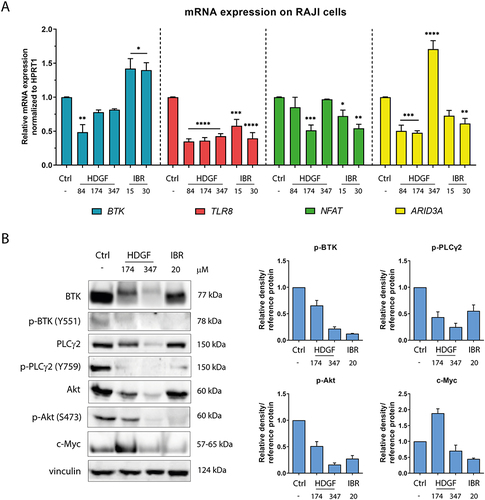
Figure 5 Impact of the tested compounds on the expression of selected genes (A) and proteins (B) associated with the BTK signaling pathway in RAJI cells. The statistical significances were calculated using one- or two-way ANOVA with Dunnett’s post hoc test: *p < 0.05, **p < 0.01, ***p < 0.001, ****p < 0.0001 compared with the untreated cells (control).